Google SecOps with Bindplane Quick Start
The fastest way to configure Bindplane with Google SecOps and start ingesting telemetry right away.
Sign up for Bindplane Cloud. We recommend using Bindplane Cloud to get started. It's the fastest and easiest way to build out your telemetry pipelines. It includes a free tier for proof-of-concepts and development projects.
If you want to see self-hosted options, view the solutions, here.
note
The initial license will be the “Free” edition. This has full functionality, but is limited to a maximum of 10 collectors. To change license levels, contact support@bindplane.com, or post a question in the Bindplane Community Slack.
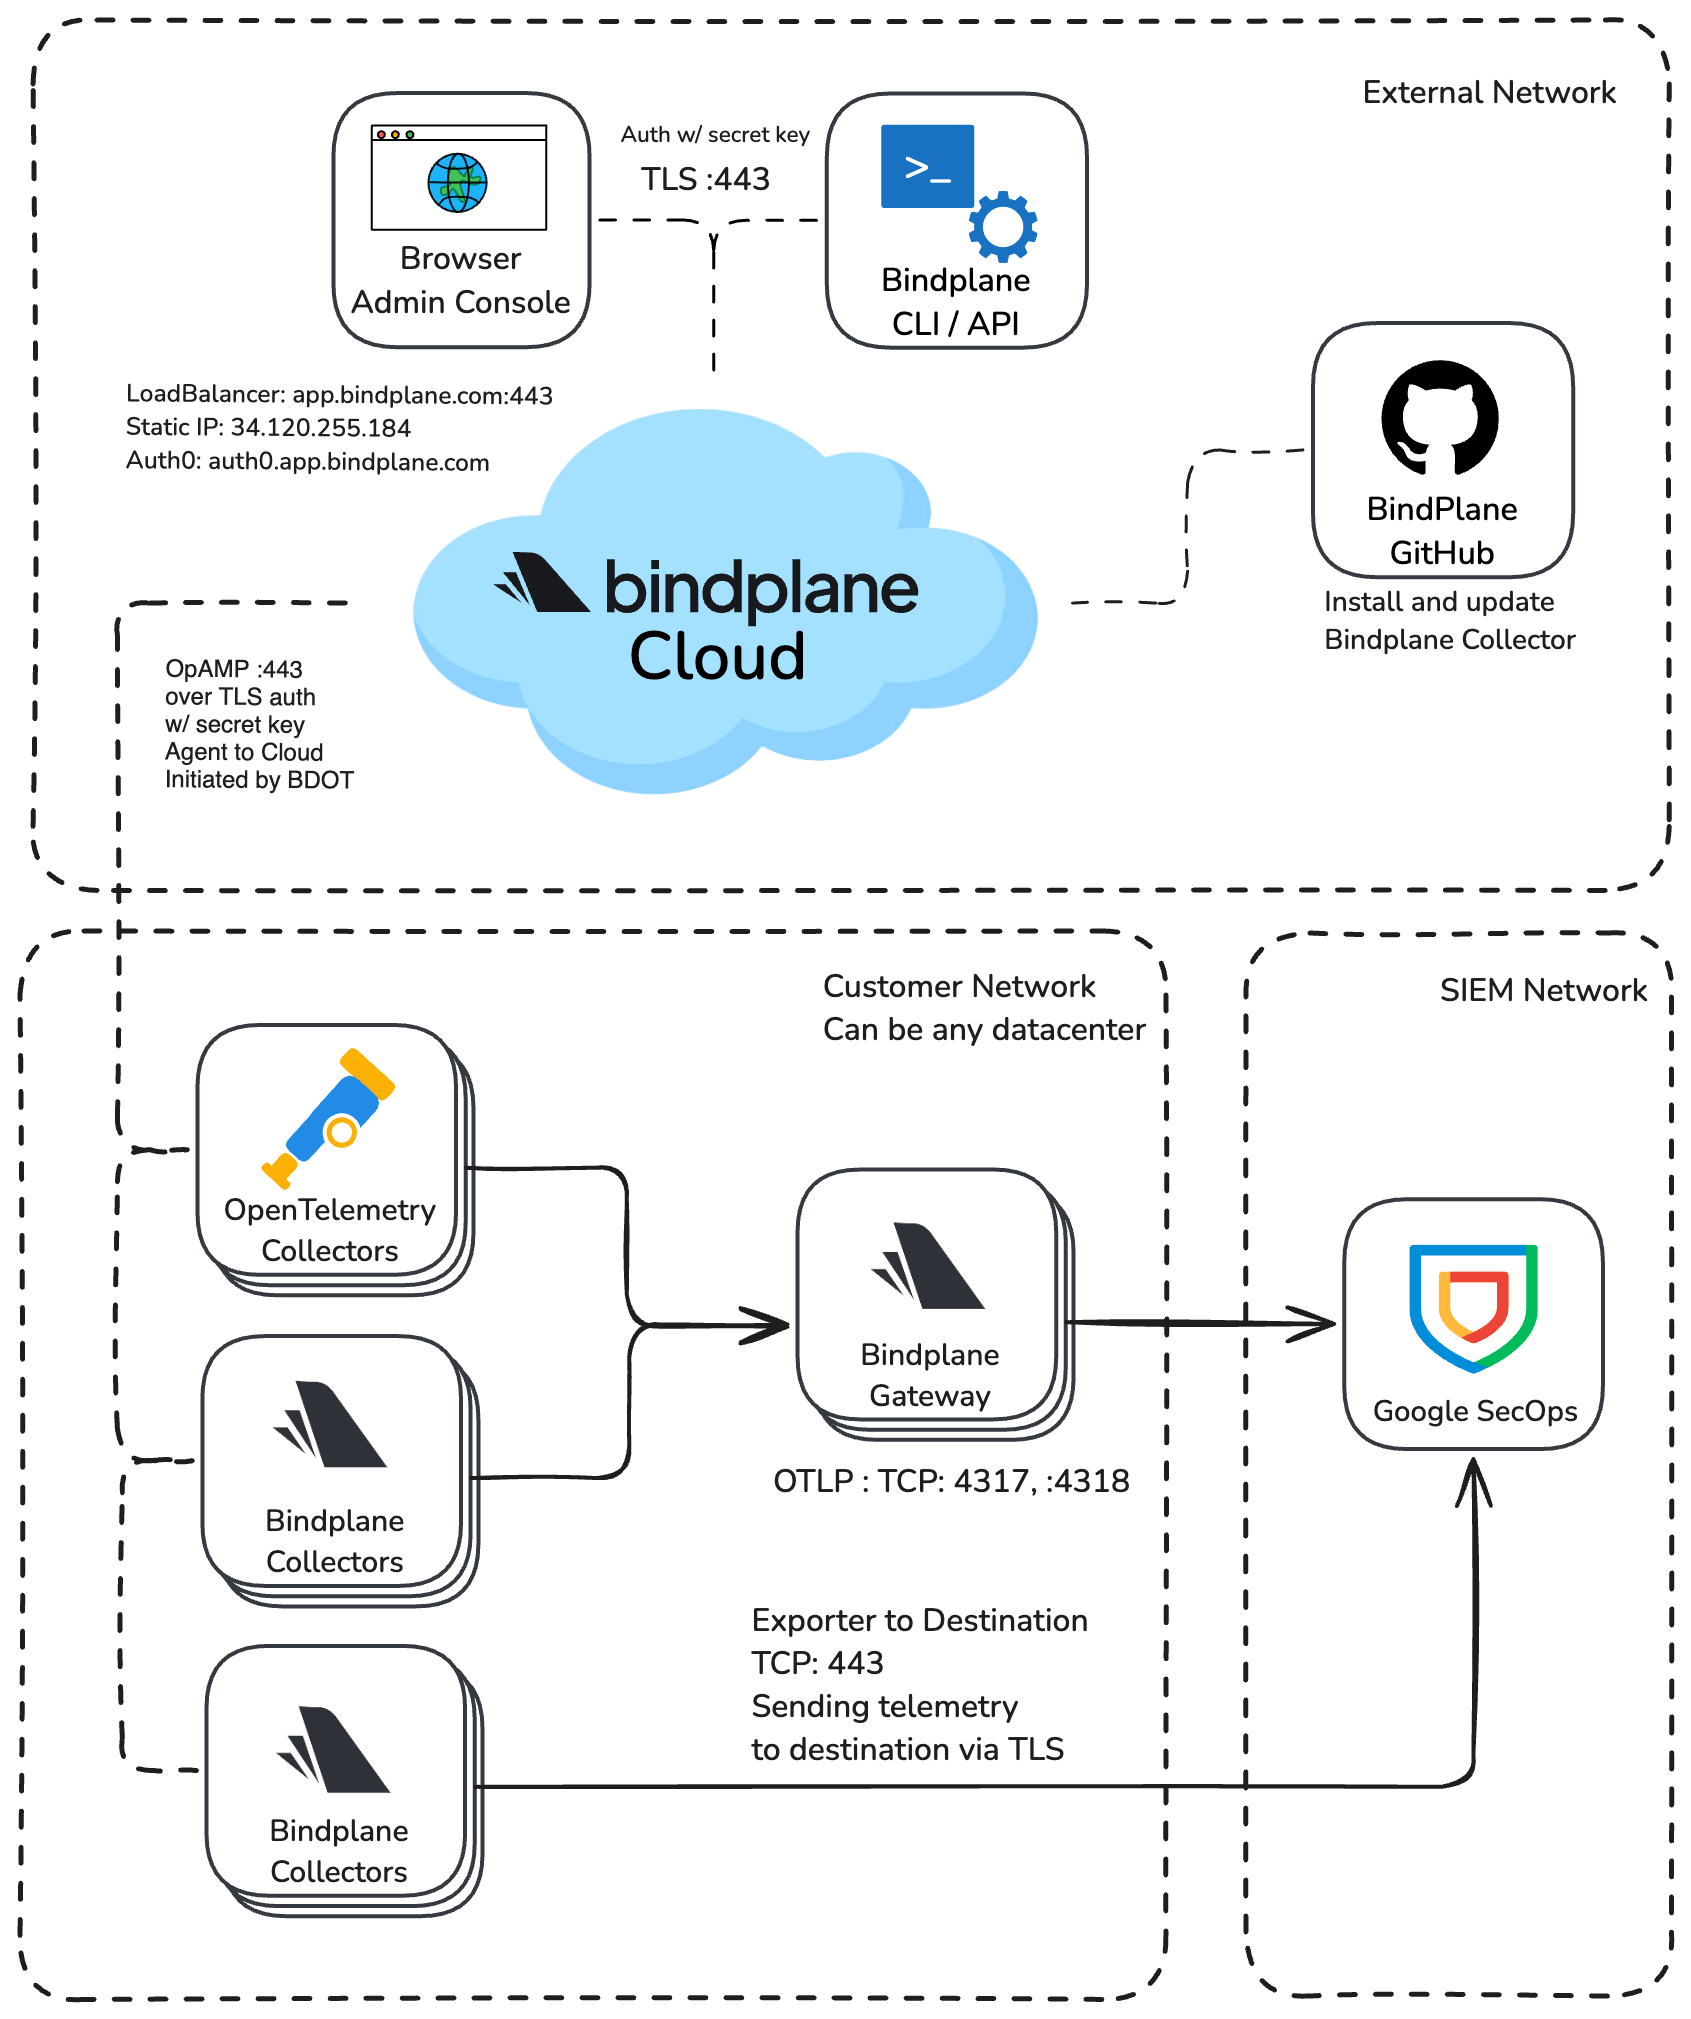
Bindplane Architecture Diagram
Configure your Bindplane Organization
Give your Organization a name.

After you sign in for the first time, you can check in the Organization, Project, and License level in the upper right menu.

Configure the SecOps Destination
Create a Configuration with a Destination for sending data to your Google SecOps instance.
Destinations can be created within Configurations for Agents. You'll learn how to create one in the Library, so that it can be used by multiple Configurations.
Go to Library in the UI. Click Add Destination, and select Google SecOps.


You can use two different APIs within Google SecOps. This guide will showcase the default gRPC API.
You can set the appropriate region, by following the “Read More About Regional Endpoints” link and finding the endpoint appropriate for your area.

Customer ID
You can find your SecOps Customer ID under Settings > Profile > Organization Details in the SecOps Interface.

JSON Authentication
JSON Authentication is the recommended Authentication Method for sending data to SecOps.
You can download a JSON file from the SecOps Interface under Settings > Collection Agents > Ingestion Authentication File.

Copy and paste the JSON contents into the Credentials field and set the Customer ID. These are the two required settings to send data to Google SecOps.
Save the configuration, and name the Destination Configuration.

It's now saved to the Library and can be used for any of your Configurations.
Configure Linux auditd Log Collection
Now, you'll configure collection of auditd logs on a Linux machine.
note
Deploy/have access to a Linux system with auditd. Here's a list of supported operating systems. We recommend deploying on a GCE instance with CentOS, CentOS Stream 9.
Install a Collector
First, deploy the BDOT Collector on your Linux machine. Navigate to Agents > Platform Linux, and select Agent Type of 1.x.

The next step will have a one-line install script. Run this on your Linux machine wait to see the OTel Collector appear in the list.


Configure the Linux auditd Logs Source
Create a new Configuration.

Add the "File" Source.

Add the default file path for auditd.
Set Parse Format: None. This is because parsing is done in Google SecOps and is not required beforehand.
Set the Start At to beginning.

Add the Google SecOps Destination that was created earlier and Save the Configuration.

The configuration will not have any collectors attached right away. To add a collector, click the Add Agent at the bottom of the Configuration and Start Rollout to deploy it.

View the Configuration File
You can view the OpenTelemetry Collector pipeline configuration by clicking View Configuration File.
This pipeline may be useful for troubleshooting, or as a reference. This is the configuration that is rolled out to the collectors via the OpAMP protocol.

Configure SecOps Standardization Processor
The auditd logs are now flowing to Google SecOps via the collector. You can see it in the processor view where Bindplane shows a snapshot of the telemetry via the OpAMP connection.

Follow the Recommendation with View, where it will show an example SecOps Standardization processor configuration.
Set these values in the SecOps Standardization Processor configuration:
- Log type: AUDITD
- Namespace: linux-app-audit
- Ingestion Labels KV: application training

This will add the following Attributes field. Note that these fields could also be added manually with the Add Fields processor. The SecOps Standardization makes this easy to do.

Silent Host Monitoring
View the Silent Host Monitoring how-to guide to learn more.
Configure Windows Events Log Collection
The same configuration will work for Windows Events as a Source.
Make sure to check Raw Logs, under Advanced in the Windows Event Source
