How to Filter and Reduce AI Agent Telemetry with OpenTelemetry & Bindplane
Build a Bindplane pipeline that keeps the cost, token, and tool-outcome signals in Claude Code's telemetry and drops the transcript you're paying to store.

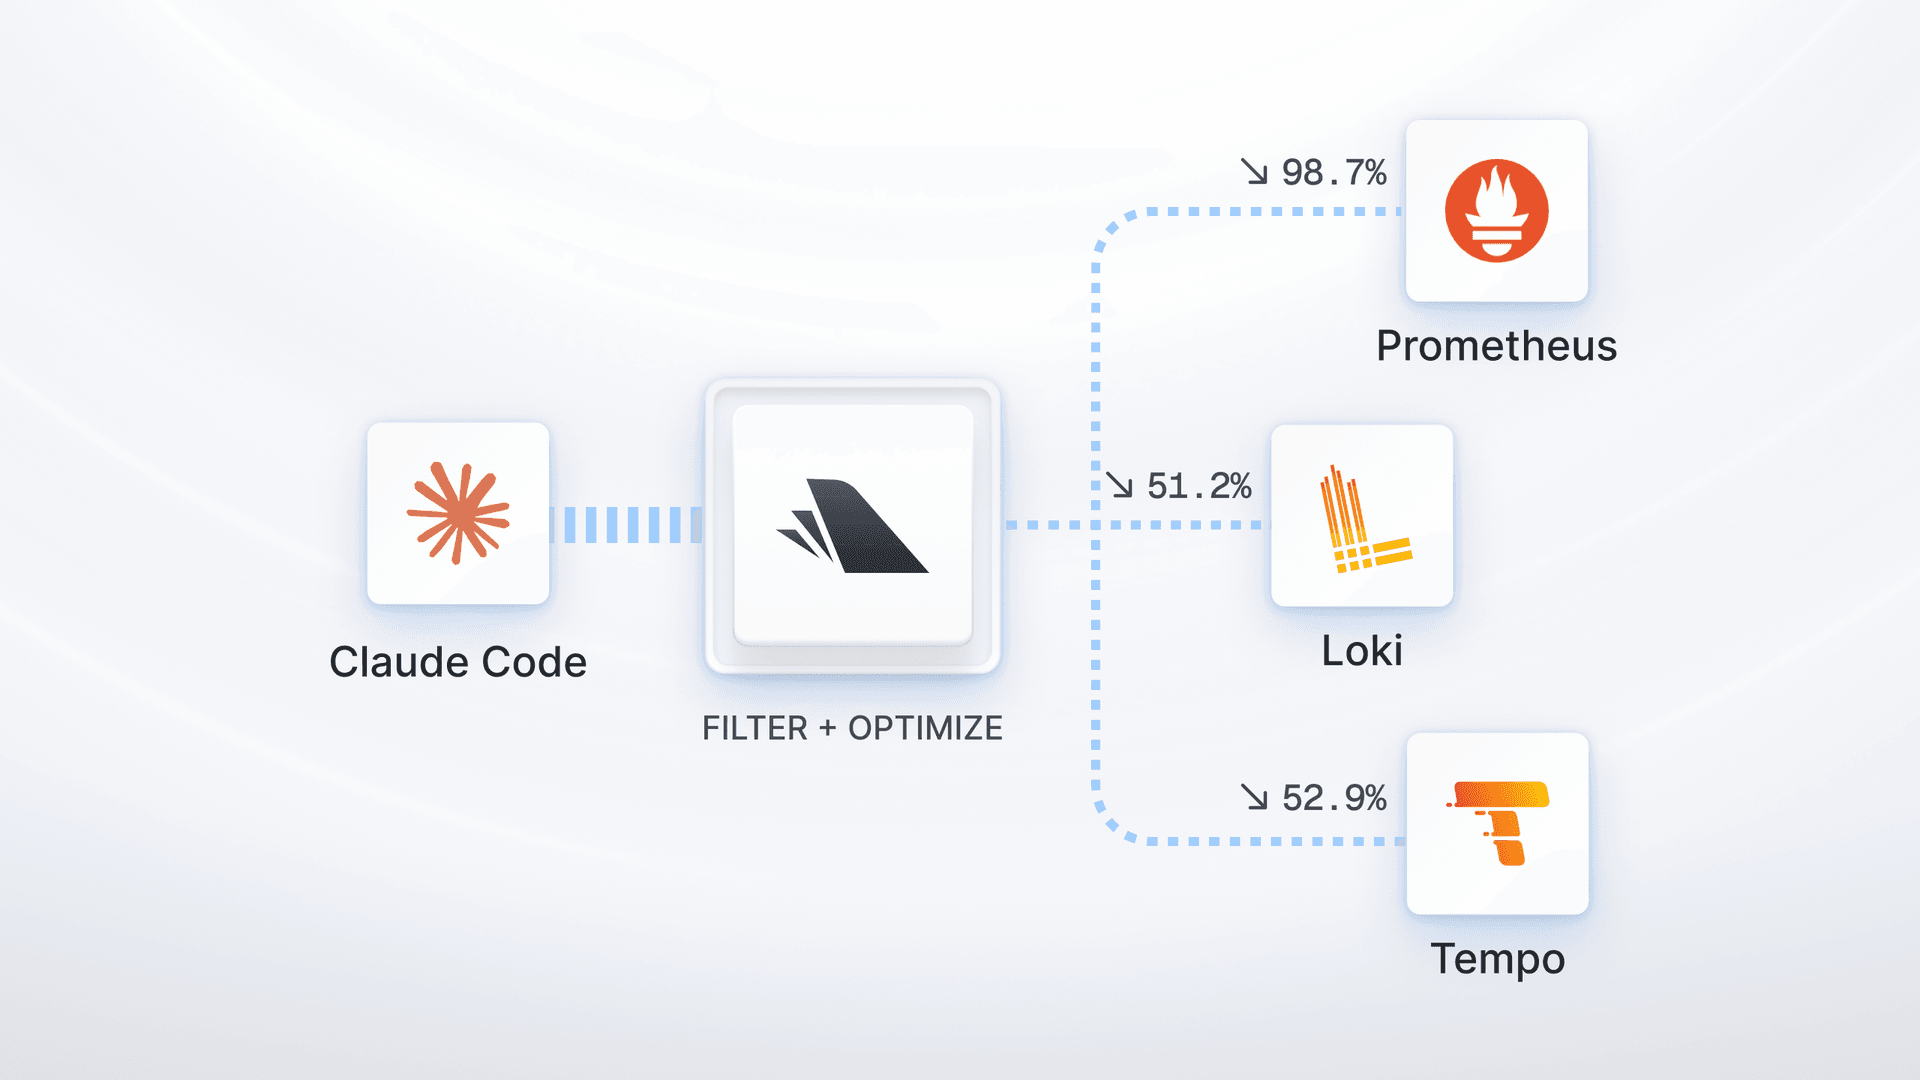
Why is the telemetry AI agents generate so intimidating? If you turn on Claude Code’s internal telemetry it’ll throw a wall of text at you. And, it’s very expensive to store. But, the bigger issue is that you can’t make sense of it.
Luckily it’s all OpenTelemetry native. That means you can configure it to send, transform, and store what you really need. Which raises the only question that matters. What do you actually need?
The requirement isn’t “collect less,” it’s “keep what answers a question”
I gave Claude Code a small, boring, task. Fix two failing tests in a pricing module, then add tests for a discount function. It did it. But I had no idea what it had actually done.
I had every telemetry content flag turned on because I wanted to see what the agent was doing. That one task produced 181 telemetry records and 289 KB of JSON.
Everything I needed was in there. It just arrived in a shape you can't answer a question with.
Let me show you how to do it with Bindplane. This tutorial builds a pipeline step by step. I’ll use one OTLP source for Claude Code forwarding to an LGTM Grafana stack. The reduction will be visible on the pipeline canvas as each processor gets added, and proof in Grafana that nothing you needed went missing.
I used Claude Code in this demo because its telemetry schema is public and OTel-native. This pattern transfers to any AI agent.
My requirements are both sending fewer bytes to reduce cost, and to answer the questions below.
Every one is answered by a counter or a short attribute. Not one of them needs the text of a prompt, the body of a file, or a diff. If no dashboard, alert or query reads a field, it isn’t observability. It’s storage you’re paying to index.
Where the volume actually lives
A web service handles a request and emits a trace. You know roughly what a trace costs because the shape repeats.
An agent runs a loop. Prompt → model call → tool call → result → decide → repeat. One interaction is a claude_code.interaction span with an llm_request child per model turn and a tool child per tool call. Each tool span, if you’ve turned on tool content, has a tool.output span event carrying whatever the tool returns.
Here’s one tool span in Tempo, a 310 millisecond ls -la, with its tool.output event expanded.

That’s a directory listing. When the tool is Read, the event contains the file. A 40 KB file becomes a 40 KB span event. Claude Code caps each attribute at a 60 KB ceiling.
Logs have the same shape where the tool_result and tool_decision events carry tool_parameters, the JSON arguments the tool was called with, and for a Write that’s the entire file being written. The same content that’s already sitting in the tool.output span event. You’re storing the transcript twice.
What we’re building
One OpenTelemetry source that gathers Claude Code’s internal telemetry. Three destinations, one per signal. Logs to Loki, metrics to Prometheus, traces to Tempo. Each destination gets its own small processor stack, because each signal needs different processors.

Four buckets decide what happens to every field. Keep what answers a question, shrink what's too big, drop what answers nothing, hash what identifies someone
Always keep. Cost, tokens, tool outcomes, permission decisions, errors, latency. tool_decision is the most important attribute.
Reduce. Keep the record, shrink the field. An error truncated to 256 characters still tells you the error class.
Drop. Whole records that answer nothing. claude_code.api_request carries a model name and a request id. Nothing is lost if you drop it.
Hash. Identity you need to correlate but not to read. session.id and user.id become a short digest, still joinable, no longer a raw identifier sitting in a telemetry backend.
Step 1. Start with everything flowing
Point Claude Code at the collector:
1export CLAUDE_CODE_ENABLE_TELEMETRY=1
2export CLAUDE_CODE_ENHANCED_TELEMETRY_BETA=1
3export OTEL_METRICS_EXPORTER=otlp
4export OTEL_LOGS_EXPORTER=otlp
5export OTEL_TRACES_EXPORTER=otlp
6export OTEL_EXPORTER_OTLP_PROTOCOL=grpc
7export OTEL_EXPORTER_OTLP_ENDPOINT=http://localhost:4317
8export OTEL_LOG_USER_PROMPTS=1
9export OTEL_LOG_ASSISTANT_RESPONSES=1
10export OTEL_LOG_TOOL_DETAILS=1
11export OTEL_LOG_TOOL_CONTENT=1Step 2. Logs. Drop, delete, trim, hash
Before any processors are added, the logs pipeline looks like this.

The baseline is 16MB/m of data egress. Open the Loki destination and add processors in this order.

The live preview shows 278 records went in and 198 came out. Let me explain it step by step.
Filter by Condition. One OTTL condition, attributes["event.name"] == "api_request" drops roughly a quarter of log records without losing signals.

Delete Fields. Six attributes deleted from every log record. prompt, response, tool_parameters, workspace.host_paths, user.email, terminal.type.

tool_parameters is the big one. The prompt_length and response_length fields stay, so you still see size trends without the text.
Transform. Three statements in OTTL for what’s left. I want to hash the two identifiers session.id and user.id, and truncate the error field that survives.
1set(log.attributes["session.id"], Substring(SHA256(log.attributes["session.id"]), 0, 16)) where log.attributes["session.id"] != nil
2set(log.attributes["user.id"], Substring(SHA256(log.attributes["user.id"]), 0, 16)) where log.attributes["user.id"] != nil
3set(log.attributes["error"], Substring(log.attributes["error"], 0, 256)) where log.attributes["error"] != nil and Len(log.attributes["error"]) > 256
Hash narrowly. Every field you hash is a field you can’t read in a log viewer. Session and user ids are safe because you only ever join on them.
Rolling out these processors will cut the log egress in half.

You’ll see a 51.2% reduction in logs sent to Loki.
Step 3. Metrics. Delete the dimension
The biggest issue with Claude Code metrics is cardinality. Keeping this in check will drastically reduce metrics egress.
Here’s the metrics pipeline before adding any processors.

The baseline is 4.9MB/m of data egress. Open the Prometheus destination processor node and add processors in this order.

You’ll retain the same amount of metrics at 176, but reduce the bytes that exit the pipeline.
Delete Fields. Six attributes are deleted from every data point. session.id, user.account_uuid, user.account_id, user.id, user.email, terminal.type. That’ll reduce 300 unique metric series down to 12. It’ll be 12 with the content flags on or off.

Sum the sessions, then convert. Claude Code exports delta temporality. Each point says "this much happened between this start time and this time," and Prometheus only accepts cumulative, so a delta to cumulative conversion has to sit at the end of this stack. With session.id gone, every session running at the same moment writes into the same 12 series, and their delta windows overlap.
The conversion keeps a running total per series and only accepts points in order, so overlapping points from other sessions get dropped. Sum the sessions per window first, and it sees one point per series instead of twenty five.
Add a batch processor.

Then, groupbyattrs.

And, a timestamp transform.

Finally, add delta to cumulative.

Here’s a reference of all the custom YAML:
1# The size is out of reach so the timeout is always what flushes. A
2# batch flushed by size could land in the same second as the last one.
3batch:
4  send_batch_size: 1000000
5  send_batch_max_size: 0
6  timeout: 2s
7# No keys means compaction: every metric of the same name under one
8# resource, so the next processor can see all the sessions at once.
9groupbyattrs: {}
10# aggregate_on_attributes only merges points with the same timestamp,
11# so every point in the window gets the collector's clock first.
12transform:
13  error_mode: ignore
14  metric_statements:
15    - context: datapoint
16      statements:
17        - set(datapoint.time, TruncateTime(Now(), Duration("1s")))
18        - set(datapoint.start_time, datapoint.time)
19    - context: metric
20      statements:
21        - aggregate_on_attributes("sum")
22deltatocumulative:
23 max_stale: 5mRolling out these processors will cut the metrics egress by 98.7% while keeping the same number of metrics data points. You’re only reducing fields that needlessly bloat cardinality.

Step 4. Traces. Trim, don’t sample
Traces are the biggest stream, and the one you tend to reach for sampling on first.

The baseline is 16.9MB/m of data egress. Open the Tempo destination and add processors in this order.

One Filter processor and two Transform processors. I’m dropping successful tool executions, deleting redundant keys and trimming the output.
Filter by Condition. Drop tool.execution when the tool succeeded.
1span.name == "claude_code.tool.execution" and span.attributes["success"] == true and span.attributes["error_class"] == nil
The parent already has tool_name, duration_ms and result_tokens. The child only adds something when it fails. Keep the failures, drop the rest, and the tool.execution span becomes the failure signal by itself. This removes a fifth of the bytes without losing signals.
Transform span context. Delete what repeats and hash sensitive data.
1delete_key(span.attributes, "user_prompt") where span.name == "claude_code.interaction"
2delete_key(span.attributes, "user.email")
3delete_key(span.attributes, "terminal.type")
4delete_key(span.attributes, "user.account_uuid")
5delete_key(span.attributes, "user.account_id")
6delete_key(span.attributes, "organization.id")
7delete_key(span.attributes, "span.type")
8delete_key(span.attributes, "tool_use_id")
9delete_key(span.attributes, "request_id")
10delete_key(span.attributes, "model")
11delete_key(span.attributes, "stop_reason")
12delete_key(span.attributes, "full_command") where span.attributes["full_command"] != nil and IsMatch(span.attributes["full_command"], "(sk-ant-|gh[pousr]_|AKIA[0-9A-Z]{16}|(?i)(password|secret|token)\\s*=)")
13set(span.attributes["user.id"], Substring(SHA256(span.attributes["user.id"]), 0, 16)) where span.attributes["user.id"] != nil
14set(span.attributes["session.id"], Substring(SHA256(span.attributes["session.id"]), 0, 16)) where span.attributes["session.id"] != nil
Twelve deletes. span.type is a copy of the span name. tool_use_id, request_id, model and stop_reason are the Claude specific half of a pair whose other half is gen_ai.tool.call.id, gen_ai.response.id, gen_ai.request.model and gen_ai.response.finish_reasons. I kept the gen_ai.* names because they're the OpenTelemetry GenAI semantic convention and still mean something to a tool that's never heard of Claude Code. The rest are identity and prompt text. The last two statements hash what's left of the identity.
Transform span event context. Truncate spanevent attributes content , output, or diff to 512 characters, move them onto the span, and add another content_truncated_by_pipeline attribute so nobody mistakes a truncated field for a short one.
1set(span.attributes["content_truncated_by_pipeline"], true) where spanevent.attributes["content"] != nil and Len(spanevent.attributes["content"]) > 512
2set(span.attributes["content"], Substring(spanevent.attributes["content"], 0, 512)) where spanevent.attributes["content"] != nil and Len(spanevent.attributes["content"]) > 512
3delete_key(spanevent.attributes, "content")
Repeat the same three statements for output and diff. The ls -la stays readable. A 40 KB file read does not, and that's the point.
Roll out the processors and you’ll see trace throughput go down from 16.9MB/m to 8MB/m. A 52.9% reduction in data egress without sampling.

Sampling would reduce it further. I left it out, because sampling trades away the one thing traces are for, which is pulling up the specific run someone is asking about. If truncation isn't enough, tail sampling is the next step. This block keeps errors and slow traces and 10 percent of the rest:
1tail_sampling:
2    decision_wait: 120s
3    num_traces: 50000
4    decision_cache:
5      sampled_cache_size: 100000
6      non_sampled_cache_size: 100000
7    policies:
8      - name: errors
9        type: status_code
10        status_code:
11          status_codes: [ERROR]
12      - name: slow
13        type: latency
14        latency:
15          threshold_ms: 60000
16      - name: baseline
17        type: probabilistic
18        probabilistic:
19 sampling_percentage: 10Step 5. Prove nothing you needed was lost
Now the whole configuration.

Metrics egress falls the most because deleting six attributes off every data point is most of the payload. Logs and traces fall by about half.
The objection to any of this is always the same.
“We lose data.”
Let’s check in Grafana. I’ve created a dashboard that reads the collector’s own metrics and the telemetry ingested into Grafana, with the raw path in red and the optimized path in green on every panel.

The top row is cardinality. With 300 series on the raw side and 12 on the optimized side you can see the little time series panel on the right showing the value over time. In a real fleet the red line will climb with every new session. Green is flat at 12 because there’s no per session dimension left for it to grow along.
The middle row is bytes per minute per signal. The gap between the lines is what you’ll save in storage costs. The panels below show a percentage of how many bytes you are reducing.
The bottom row is record counts. Metric data points don't drop, but their size does. Logs lose the api_request events, traces lose the successful tool.execution spans, and that's all you’re deleting.
I’ve also built a second dashboard. It reads the optimized telemetry stream and answers my six questions from the beginning of the tutorial.

You can see tokens by type, where cache reads dwarf everything else. Cost by model. Log volume. Lines of code added and removed. This also proves the data throughput and ultimately the price you pay for storage goes down without losing answers.
Where this applies
If you've dismissed AI agent telemetry as "all prompts, nothing to dashboard," you're solving a bigger problem than the one you actually have. You don't need the transcript in your telemetry backend. You need answers to your biggest questions. The transcript can live somewhere cheaper. That's a much smaller problem, and Bindplane solves it in an afternoon. Every processor here is a handful of OTTL lines or a list of field names, and I watched each one change the graph within a minute of hitting Start Rollout.
Go look at your own agent. Pick one metric and count distinct attribute combinations over the last week. Most teams have never checked. If that number grows with usage instead of with deployments, you have this problem, and one Delete Fields processor fixes it.
Want to try this on your own agent telemetry without writing the YAML by hand? Check out Bindplane.



 Slack
Slack GitHub
 x.com
x.com LinkedIn