OpenTelemetry at the edge: Observability for IoT fleets with Bindplane and Dynatrace
When an edge device goes blind, the cost shows up as tripped relays and spoiled stock, not missing datapoints, and this guide covers how to close that gap with OpenTelemetry.

By the time an IoT device shows up in an incident review, it has usually already done its damage. Not the dashboard-gap kind. These devices are load bearing. They sit in the control path of substations, haul trucks, pump stations and cold rooms, so when they go blind the blast radius gets measured in tripped relays, spoiled stock, and unplanned outages rather than in missing datapoints.
The end-to-end story only closes when three things land in the same backend as the applications that consume them:
- Device health.
- Device logs.
- The business telemetry the device itself produces.
Anything else, including the physical layer, stays a blind spot in your service topology.
Today I’ll explain how to close that gap with OpenTelemetry, using the Bindplane Distro for OpenTelemetry (BDOT) as the collector and Bindplane as the control plane. You'll also learn where you can and cannot run a collector in the first place.
Whatever industry you run infrastructure in, and wherever in the world you run it, the list will feel familiar. In energy and utilities, it is substation RTUs, smart meters, and DER inverter gateways. In mining, it is autonomous haulage telemetry and conveyor vibration monitors. In water, it is SCADA RTUs at pump stations and reservoir telemetry. The same pattern repeats across manufacturing, agriculture, transport, and retail logistics.
What they have in common is not their number. It is that they are unattended, often sitting on flaky links, and installed in physically hostile places you cannot reach quickly. Nobody walks over to a substation gateway to check why it stopped reporting. It fails silently. You find out when the downstream device, like a protection scheme, haul cycle, or chilled aisle, starts misbehaving.
The shape of the problem
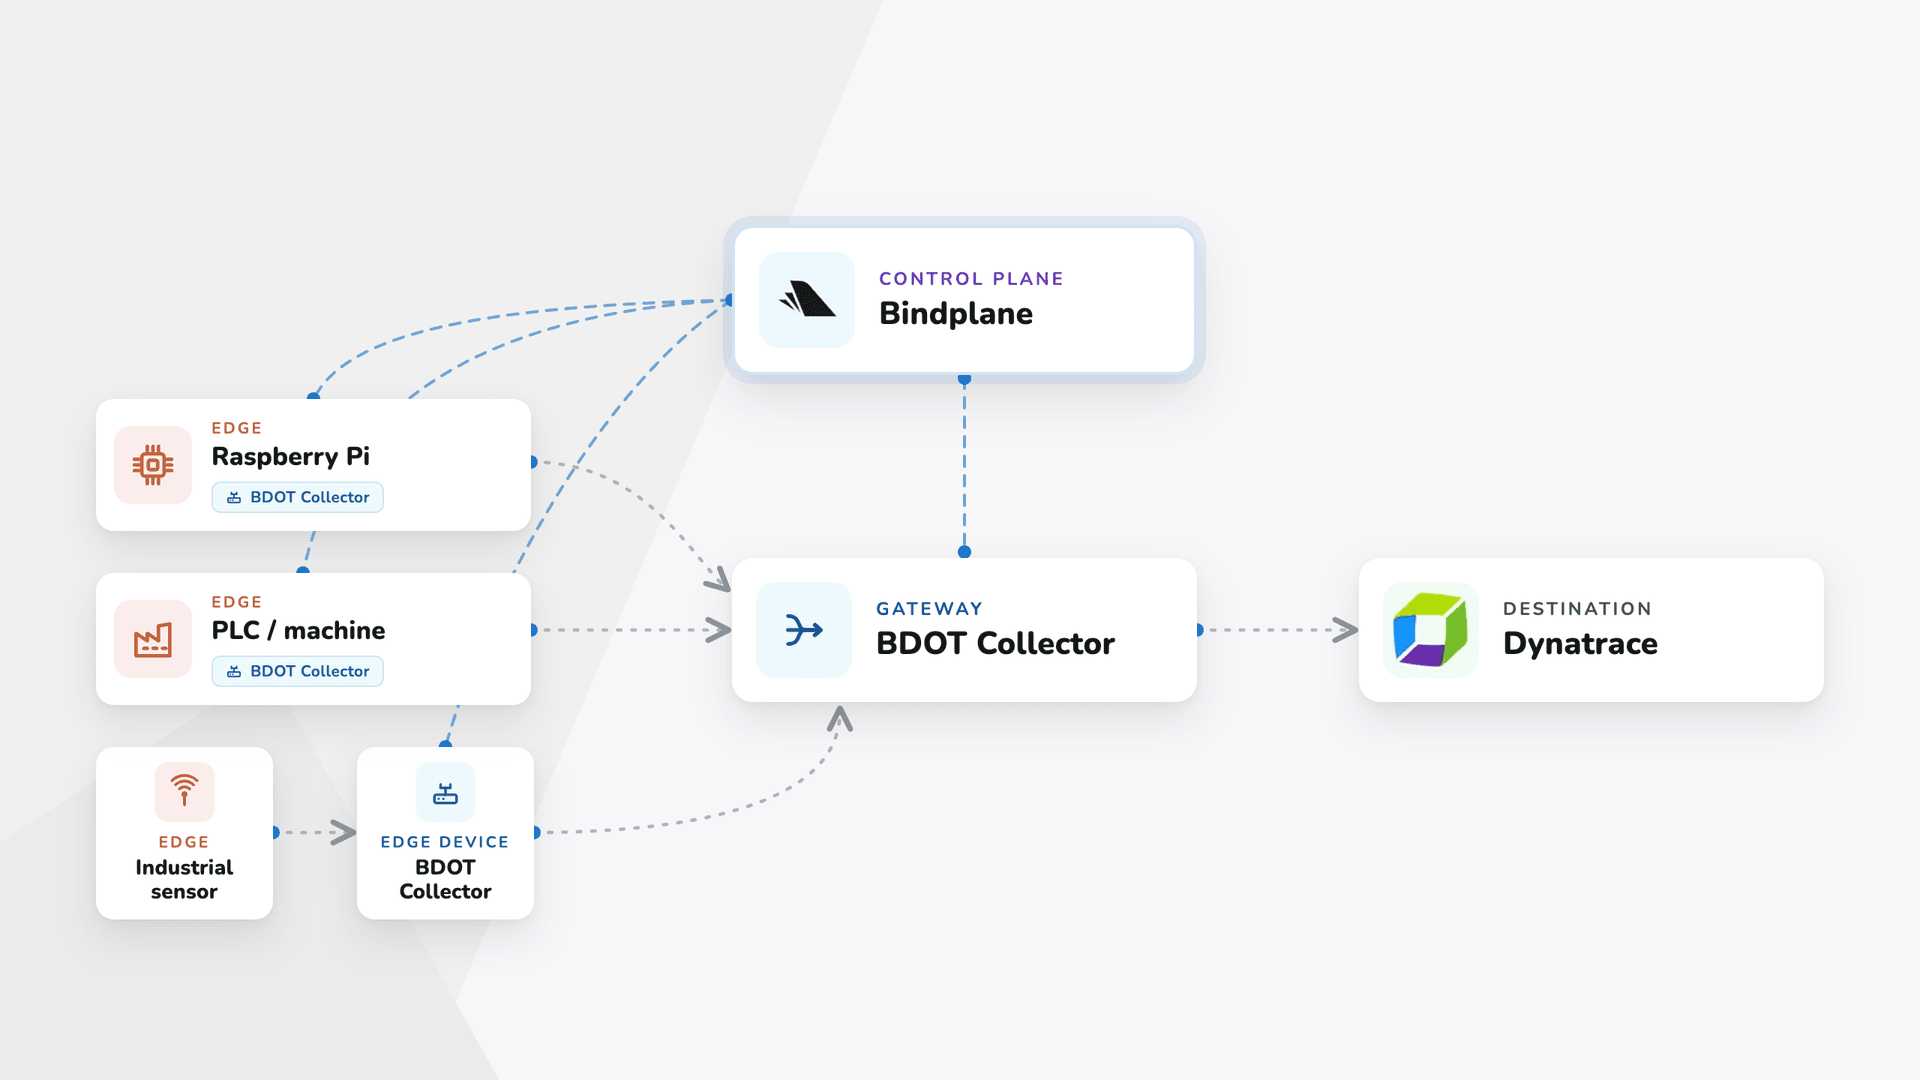
Telemetry lives in three layers, with a fourth plane sitting over the top. Reading it from the device outwards:
- Edge collector: Runs on the device itself and does the local work, scraping hostmetrics, reading journald, and tailing the application's own files.
- Gateway collector: Sits at the edge of the site network, aggregates several sites, handles tail sampling and dedupe, and owns egress to the destination.
- Destination: I’m using Dynatrace in this guide. It's the place where device signals finally sit next to application traces.
- Control plane: Bindplane uses OpAMP to update collector configs, read collector versions and health, and manage fleets of collectors.

On the left of the diagram, you have IoT devices at the edge: Raspberry PIs, sensors, and other modules that support installing an OpenTelemetry collector. The collectors on those devices are deliberately designed not to do any processing. They collect, and they forward, and that is it. Not every edge device can run a collector, however. The ones that can’t, speak their own protocol to the nearest edge device or IoT hardware that can.
These edge collectors forward telemetry to a gateway collector in the middle. The gateway collector has access to a stable network with more CPU and memory than an IoT device will ever have. Here’s where you do the expensive work. Filtering out what does not earn its bytes, enriching with site and asset identity, and batching. This now enriched and optimised telemetry is what gets sent on to a backend like Dynatrace, as logs, metrics and traces.
Sitting over the top of all of it is Bindplane, the control plane. Telemetry travels left to right; config, collector versions and agent health travel the other way, pushed down to every collector over OpAMP. That is how you manage a fleet at scale instead of SSHing into devices one at a time.
The obvious question is why the edge collector exists at all, and why you would not just point every device straight at the backend. There are three reasons, and none of them are academic. WAN egress on a metered cellular or satellite link is a real line item, and raw hostmetrics at 10-second resolution will show up on the bill. Connectivity is intermittent, so something local has to buffer. And cardinality has to be controlled before it leaves the device, because once a few hundred devices each invent their own label values, that becomes someone's ingest cost and query latency to clean up later. The gateway exists for the same reasons one level up, at site scale.
Where can the collector run?
The question is never whether something counts as IoT or an edge device. It comes down to four critical constraints:
- the CPU architecture
- the libc
- how to run a long-lived service
- enough flash to hold the binary
With these four, any device is a candidate. Get any one of them wrong and no amount of enthusiasm changes the answer.
BDOT ships supported, signed, Linux packages for amd64 and arm64, which covers the overwhelming majority of IoT hardware you would deploy today: Raspberry PI 4 and 5, Jetson Orin, the Siemens IOT2050, and every industrial x86 gateway in the rack. Install the package, adopt the config, and the device is under fleet management from its first heartbeat.
The long tail is older 32-bit armv7 hardware: the earlier Moxa UC units, the BeagleBone Black, the Digi CC6UL and any Pi still running a 32-bit OS. There is no stock BDOT package for those, which is worth knowing before you plan a rollout, but it is not a dead end either. Upstream otelcol-contrib publishes an armv7 build you can install yourself, and when you want that collector under the same control plane as the rest of the fleet, you build it with the OpenTelemetry Distribution Builder and register it in Bindplane as a BYOC Agent Type. From here, Bindplane manages the custom built collector exactly like an instance of the BDOT Collector. And for the devices that cannot run a collector at all, nothing is lost: the gateway collector next to them speaks their protocol and brings them into the same pipeline.
That gives you three buckets, and the rest of this section works through them: the hardware that takes a stock BDOT package today, the hardware that needs a build of your own, and the endpoints where you should not put a collector on the device at all.
Devices that run a stock BDOT package today
Devices that need a custom build (ODB + BYOC Agent Type)
Devices where you should not run a collector: Use the gateway pattern
For these endpoints, the collector does not live on the device at all. It lives on the nearest hardware that can run a general-purpose Linux system, usually a site gateway, an industrial PC in the same cabinet, or a small VM at the regional edge. It reaches the devices over whatever they already speak: MQTT from sensors and inverters, Modbus TCP or RTU from RTUs and meters, OPC UA from line-side aggregators, CoAP from constrained radio nodes, LoRaWAN via the network server, and SNMP or a vendor API for closed appliances such as Cradlepoint or AirLink routers.
Of the device protocols on that list, SNMP is the only one a collector can poll directly. For the rest, including MQTT, there is no receiver, so the collector cannot ingest at all. Something has to sit alongside it and do the conversion: Telegraf, a historian or vendor bridge such as Kepware or Ignition, a purpose-built bridge app, or the LoRaWAN network server itself. The bridge turns the device's data into a log or a metric and writes it out as a file or over OTLP, and the collector picks it up from there.
The other half of the pattern is what the edge collector deliberately does not do. At the site it usually runs no processors at all, because CPU cycles on a constrained box are better spent polling devices than on filtering, OTTL transforms, or attribute stamping. It receives, batches, and forwards over OTLP to a regional gateway collector, and the gateway is where the expensive work happens: dropping metrics that do not earn their bytes, cutting log volume, stamping site and asset identity, and owning egress to the backend.
Building the config

A Bindplane config is the resource you manage, and it maps one-to-many onto collectors. You pin the Agent Type and Platform once, at creation, and every device that adopts the config inherits them. Name it “IoT-devices” for the fleet it serves, IoT and edge devices in this case, because that name is what you will be labelling, rolling out and rolling back against for the life of the deployment.

The host source is where most people over-collect. The right instinct is to argue about what to turn off, not what to turn on. Bindplane gives you metric-level checkboxes, not just scraper-level ones, so use them. Drop system.cpu.time, because the cumulative counter is redundant once you have system.cpu.utilization, and on a device whose state changes slowly you will never query it. But do not drop the disk metrics. On a Pi-class device, system.disk.io_time and system.disk.pending_operations are your early-warning system for a dying SD card. They climb weeks before the card fails, and a failed card is a truck roll, so leave them on.
One cheap win specific to ARM SBCs is to enable system.cpu.frequency. When the SoC thermally throttles, it drops the clock, so frequency gives you a near-free thermal signal without a dedicated temperature scraper. Set the interval to 30s rather than 10s as well. Ten-second collection is three times the datapoints and three times the egress for no operational gain on a device that does not change state on that timescale.
Logs from journald and files
On a device running systemd, take the logs from journald rather than tailing text files. They arrive already structured, with the unit, the severity and the host attached, so nothing has to be re-parsed later just to make it queryable.
There is one trap worth knowing about. Scope a journald source down to your application and you quietly lose the kernel messages, because kernel logs do not belong to a unit. Those are the ones that warn you a Pi is about to fall over: undervoltage, SD card errors, the failures you would actually want a ticket for. Run a second source for the kernel alongside the one scoped to your application and start both from now rather than replaying the whole journal the first time the collector connects.

The file source example tails /run/dump1090-mutability/aircraft.json, an ADS-B feeder writing aircraft JSON, with a ^\{ multiline start pattern so each JSON object becomes one log record. The broader point is the whole reason you deployed a collector to the device in the first place: device-specific telemetry is why you are there. It’s the hostmetrics that tells you if the box is alive, and the application's own file tells you the box is doing its job. An ADS-B feeder writing aircraft JSON is structurally identical to a substation gateway writing IEC 61850 events, or an irrigation controller writing flow readings. It is the same receiver with a different path. Get this one file into the backend and the device stops being a heartbeat and starts being a source of truth.
Dynatrace as the Destination

Lastly, add the destination where the configuration should send telemetry out from the edge devices. Here in this case, I'm using Dynatrace which can receive logs, metrics, and traces. Bindplane pushes this configuration to the edge devices using OpAMP and the data streaming would commence once the roll out completes.
Fleet management

This is the state of a real fleet, and it is exactly why you want a control plane. Two devices sit on the same “IoT-devices” config: rpi4-bookworm is Connected on v1.88.1, rpi5-debian-k8s is Errored on v1.103.0, and an upgrade banner sits over the top. Two devices, two versions, one broken. That is not a blemish to crop out. It is the argument.
The mechanism underneath is OpAMP, which means config changes are pushed rather than SSH'd. You cannot SSH to 400 substations, and you should not want to. On a real fleet you stage the rollout: canary a label subset first, watch it, then widen. A bad config on an unreachable device is not a rollback, it’s a truck roll. The version skew in the screenshot is normal, and what matters is that you can see it and drive it down deliberately rather than discovering it during an incident.
The errored agent is the point of the whole exercise. Without a control plane, that device is just quietly not reporting, and quietly not reporting is indistinguishable from fine right up until it is not. Here it shows as a red status you can act on. Label by physical site first, then by device_class and criticality, because site is the dimension your truck rolls are actually scheduled on, and criticality is how you decide what to canary last.
Processors: the bit that pays for itself
On a metered cellular link, what you do not send is the feature. This is where that happens.

The processor performs these steps:
- The raw body is parsed.
- The array of aircraft is unrolled into one record each.
- Those records are parsed again.
- Fields are renamed and the noise stripped out.
- A condition filter drops what nobody is going to query.
- Resource detection plus a
service.nameattribute stamp identity, so the backend knows what it is looking at.
You build the chain against live data with raw records on one side and the processed result on the other, so you can see exactly what you are about to stop sending.
I’m doing all of this on the IoT device itself, and that is worth being upfront about, because it is a judgement call rather than a rule. Where the network is the constraint, on metered cellular or satellite, doing the work on the device is exactly right, since bytes you drop at the source are bytes you never pay to move. Where CPU and memory are the constraint, you keep the device collector thin and run the same chain on the gateway collector instead. The processing does not change; only where you run it does.
One thing worth doing wherever the collector runs is the persistent queue. Point the exporter's sending queue at file storage and a twenty-minute cellular outage becomes twenty minutes of buffered telemetry rather than twenty minutes of holes. On a Pi, put that storage on a USB SSD if the hardware allows it, because a queue on the SD card means write amplification, and write amplification is how you kill SD cards.
Telemetry from IoT Landing in Dynatrace

This is the ADS-B example finishing its round trip. It writes aircraft JSON to a file on the Pi, the Bindplane collector tails that file, and the records go out over OTLP to Dynatrace, where they're immediately queryable. No code was added to the feeder, and nothing bespoke was written to move the data.
What comes out the other end is a dashboard built entirely from one IoT device: unique flights tracked, the last aircraft seen and how far away it was, the altitude spread across everything in the sky, a breakdown by aircraft category, and the raw incoming stream from the ground station. That last panel is the one that matters operationally, because a gap in it is a device problem rather than an aviation one. Change the file path and this is a substation gateway publishing IEC 61850 events or an irrigation controller publishing flow readings. All using the same pipeline.
Filtering and deduping at the source, so you only pay to ship what you'll actually query, is its own topic. And, what a great topic for an upcoming blog post. Stay tuned.


 Slack
Slack GitHub
 x.com
x.com LinkedIn