Claude Code Monitoring at Scale: Gateways and Routing With OpenTelemetry
Your AI agents are already emitting telemetry to every backend at once, and this guide shows how to put a BDOT gateway in the middle so cost metrics go to Google Cloud Monitoring, the full event stream goes to Dynatrace, and sensitive data gets redacted before it ever leaves the laptop.

Chelsea and I recently wrote a guide on how we monitor Claude Code usage internally with Bindplane. TLDR; We remotely manage a Bindplane Distribution of the OpenTelemetry Collector (BDOT) that runs on every engineer's laptop.
This setup is great, but it has one downside. Sending to Google Cloud Monitoring, Swarmia, and any other destination directly from an engineer’s laptop is limited to local processing.
You can’t get the benefit of centralized routing and processing on a gateway. This also means you can’t monitor Claude Cowork since it only supports exporting telemetry server-side from Anthropic to your collector. Do you want to know how to solve this problem? Then this tutorial is for you. 👇
A Centralized Telemetry Pipeline for Claude Code
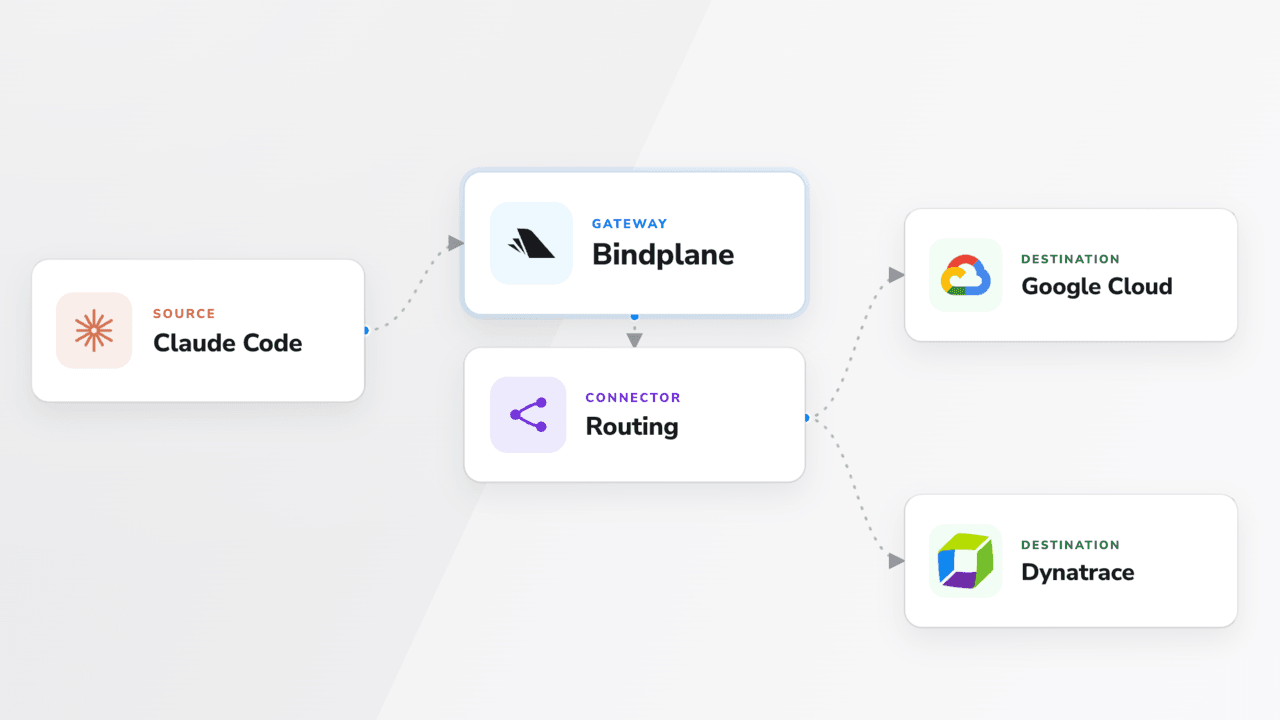
The setup is a BDOT Collector running as a gateway in the cloud, where routing and centralized processing happen. A routing connector inspects Claude Code telemetry and sends each signal where it belongs.
Here's what this guide walks through, end-to-end.
- Run a local BDOT Collector in agent-mode on an engineer workstation
- Configure a redaction processor on the agent-mode collector to mask sensitive data like emails and prompts
- Run a gateway-mode BDOT Collector in the cloud
- Configure the routing connector to split telemetry between Google Cloud Monitoring and Dynatrace
- Configure the bulk of your processing on the gateway-mode collector
This picks up where the local Claude Code monitoring setup left off. What follows is a simplified version of how Bindplane's own engineering team runs internal Claude Code monitoring.
Fan-Out Gave Us Everything. That Was the Problem.
At Bindplane, we’ve put a BDOT Collector on every dev machine and fanned the telemetry out to three destinations. We can see per-session cost, token usage, and a full audit trail of what Claude Code is doing across the team.
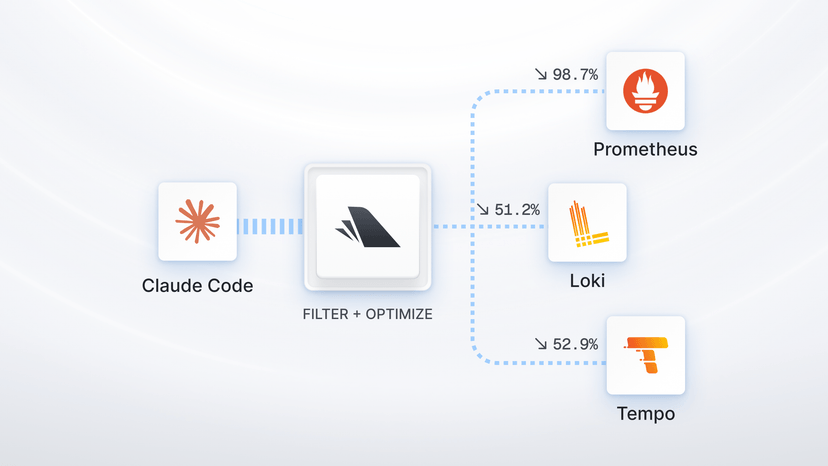
Fan-out has a cost, though. Every destination gets everything. The cost metrics that belong in a finance dashboard also hit the audit backend. The high-volume event detail that security needs lands in a metrics store that has no use for it. You pay each backend to ingest data it will never query, and every backend gets noisier as it fills with signals meant for somewhere else.
Fan-out is the right place to start, but it is the wrong place to stay. The fix is routing. Send each signal to the backend that actually needs it.
Two Tiers: Why the Collector on Your Laptop Isn't the One Talking to your Telemetry Backend
Two collectors, two jobs. The agent-mode BDOT on each laptop collects Claude Code's OTLP, redacts sensitive fields at the edge, and forwards. The gateway-mode BDOT on a remote Linux VM receives from every agent, applies the routing rules, and exports to the backends.
The split is deliberate. Destination credentials live on one gateway, not on thirty laptops. Routing logic lives in one place, so changing where a signal goes is a single edit. The laptop collector stays simple and stable: it never holds a Dynatrace token and never knows that Google Cloud Monitoring exists.

The agent's job is to collect and redact. The gateway's job is to decide and deliver.
What Claude Code Emits, and Why It Splits Cleanly
Claude Code speaks OTLP natively. Two signals matter here. Metrics answer "how much": claude_code.cost.usage, claude_code.token.usage, claude_code.session.count, and a handful more. Events answer "what happened": tool_decision, tool_result, api_request, each carrying a prompt.id that ties every API call and tool run back to the single prompt that triggered it.
Different signals serve different people. Cost and token metrics feed the dashboards leadership and FinOps care about. The event stream is the audit trail security and platform teams query when they need to know who ran what. That difference is the routing rule. For the full list of signals and what each one is good for, the first blog post in this series cover it.
Agent Setup: Collect and Redact Before Anything Leaves the Laptop
In Bindplane open the Agents page, and install a new Agent. Bindplane generates an install command with your OpAMP endpoint and secret key already embedded. Run it on the machine. The BDOT Collector installs, connects over OpAMP, and appears in the Agents table. From there it is managed from Bindplane: no backend credential on the laptop, no SSH to change it. Full steps for macOS, Linux, and Windows are in the docs.
The macOS install command looks like this:
1sudo sh -c "$(curl -fsSlL https://github.com/observiq/bindplane-agent/releases/latest/download/install_macos.sh)" \
2
3install_macos.sh -e wss://app.bindplane.com/v1/opamp -s <secret-key>
Then point Claude Code at the Collector. These environment variables enable Claude Code's native telemetry and send it to the collector on localhost. For a fleet, push them once through Claude Code's managed settings file rather than setting them per laptop.
1export CLAUDE_CODE_ENABLE_TELEMETRY=1
2export CLAUDE_CODE_ENHANCED_TELEMETRY_BETA=1
3export ENABLE_LSP_TOOL=1
4export OTEL_EXPORTER_OTLP_ENDPOINT=http://127.0.0.1:4317
5export OTEL_EXPORTER_OTLP_PROTOCOL=grpc
6export OTEL_LOGS_EXPORTER=otlp
7export OTEL_LOG_RAW_API_BODIES=1
8export OTEL_LOG_TOOL_CONTENT=1
9export OTEL_LOG_TOOL_DETAILS=1
10export OTEL_LOG_USER_PROMPTS=1
11export OTEL_METRICS_EXPORTER=otlp
12export OTEL_TRACES_EXPORTER=otlp
On the Bindplane side, build the collector configuration. Create a configuration and add an OTLP source, so the collector receives what Claude Code sends on localhost:4317.

Add a Bindplane Gateway destination, which forwards the data to the gateway-mode collector over OTLP.

Save the configuration.

Add a redaction processor and mask user.email, so it is gone before anything leaves the machine. You can ask Pipeline Intelligence to create processors that redact and mask the data you want.

It’ll automatically create the required processor and configure it to remove sensitive data and mask user.email.

Assign the configuration to the collectors you installed, and Bindplane pushes it to every laptop over OpAMP. The redaction is the whole point of the edge tier. The laptop collects and cleans, and only then forwards.

Gateway Routing: Send Cost Metrics to Google Cloud, Everything to Dynatrace
Install one more BDOT Collector on the Linux VM and create a configuration that receives OTLP using the Bindplane Gateway source. The same BDOT collector binary can run either in agent-mode or gateway-mode based on your requirements. Read this docs page to learn more.

This means every collector running on our workstations will forward telemetry to the BDOT Collector in the cloud. Then, this gateway-mode collector then holds the destination credentials for both Google Cloud Monitoring and Dynatrace. Let’s go ahead and add both as destinations in Bindplane before adding a routing connector.

Add a routing connector in the metrics pipeline. When the metric name is claude_code.cost.usage or claude_code.token.usage, send it to Google Cloud Monitoring, and route everything else to Dynatrace.

You set the condition and point each branch at a destination. Bindplane generates the routing connector underneath and pushes it to the gateway.

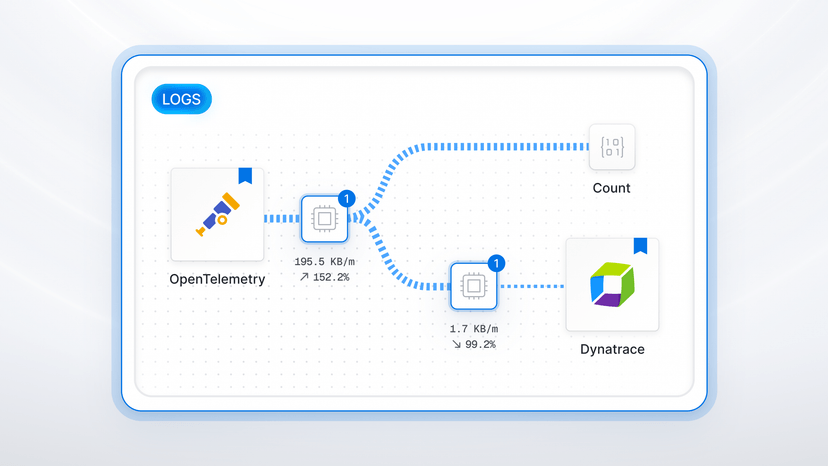
The same pattern extends to logs. Add another routing connector to the logs pipeline that peels tool_decision and permission_mode_changed events off to a Google Cloud Logging while the rest of the stream goes to Dynatrace.

The selected telemetry type is LOGS. You now have two routing connectors. One for the metrics pipeline and one for the logs pipeline.

You can manage all destinations on the gateway without needing to touch the collectors on developer laptops and workstations. Change where you want Claude telemetry to go and Bindplane rolls the update to the gateway.
What About Claude Cowork?
Cowork does not export telemetry to a collector on the developer’s laptop the way Claude Code does. Instead, export is configured centrally by admins in the Anthropic admin portal, and every Cowork instance picks it up automatically.
Since you already have a gateway running, pointing Cowork at it is most of the work. If you have admin access, go ahead and open Claude Desktop, go to Organization settings then Cowork, and enter your OTLP endpoint, which is the gateway-mode collector from above. Cowork only sends HTTP-based OTLP on 4318, so no gRPC. That’s still fine since you configured the Bindplane Gateway source to listen on both HTTP and gRPC. Please note that you need admin access. If you don’t have it, reach out to your admin to get it added.
Two caveats. Because Cowork runs in a sandbox, the gateway endpoint has to be allowlisted for outbound access, or export fails silently. And prompt content and tool parameters like file paths and commands are included by default, so the same redaction discipline applies, just on the gateway. Cowork has no edge collector to clean data at, so that masking happens before events route downstream.
What to Watch
For demo purposes, the gateway here is a single VM. That is fine for a tutorial but wrong for production. We’ve covered high-availability setups for gateway collectors in previous tutorials. Have a look:
- How to Build Resilient Telemetry Pipelines with the OpenTelemetry Collector: High Availability and Gateway Architecture
- Custom OpenTelemetry Collectors: Build, Run, and Manage at Scale
- OpenTelemetry Deep Dive: Resilience & High Availability in the OTel Collector
One gateway is a single point of failure and a throughput bottleneck. Run it redundantly behind a load balancer, which is what we do in production.
Routing is configuration, and misrouted data fails silently. A condition that never matches sends nothing to Google Cloud Monitoring, and you get no error to tell you. Use Bindplane's live preview to confirm each branch is matching what you expect before you trust the rule. Control cost while you are there. Routing controls spend by not paying every backend for everything, but Google Cloud Monitoring bills on metric cardinality and Dynatrace bills on ingest, so each attribute you keep has a price. Claude Code's OTEL_METRICS_INCLUDE_* flags let you trim cardinality at the source.
Redaction is not optional. user.email rides along by default under OAuth, and tool details can carry file paths and commands once you enable them. Redact at the agent-mode collector, before anything leaves the laptop, never at the gateway.
Want to monitor your own Claude Code telemetry without writing the YAML by hand? Try Bindplane.



 Slack
Slack GitHub
 x.com
x.com LinkedIn