Claude Code + OpenTelemetry: Per-Session Cost and Token Tracking
Your AI coding assistant is already emitting telemetry. Are you collecting it?
I was looking at our Claude Code spend in the Anthropic console the other day. Aggregate cost, aggregate tokens — no breakdown by developer, no breakdown by session. I knew my Hackathon team had been using it heavily on building out new features for the OpenTelemetry Distro Builder. But heavily how? I had no idea.
Turns out Claude Code has been emitting OpenTelemetry signals the whole time. Per-session cost, token counts, every tool call it makes on your codebase. It's opt-in, and we haven't turned it on... yet. 😎
Here's how to route it through Bindplane in about five minutes. 👇
The data you're not collecting
The Anthropic console gives you an aggregate number. That's it. You can see that your organization spent $X on Claude this month. You cannot see which developer drove that spend, which workflows burned the most tokens, or what Claude was actually doing during those sessions.
Those questions matter more than they sound. When you're rolling Claude Code out across a team, you want to know:
- What's it costing per person, per day?
- Which tasks are generating the most token spend?
- What tools is Claude calling on your codebase? Are they file edits, bash commands,
curlfetches?
The last one is interesting. Claude Code can touch a lot of code in the course of a session. Knowing which tools it's calling, and how often, is useful for understanding cost and for auditing what's actually happening.
None of this requires custom instrumentation. Claude Code already emits all of it.
What Claude Code emits
Here's the part that surprised me.
Every Claude Code session exports OpenTelemetry signals to any OTLP endpoint. It's been doing it since you installed it, I just haven't pointed it anywhere yet.
Every record carries a service.name=claude-code attribute, so isolating Claude Code telemetry in a mixed pipeline is trivial.
Telemetry is off by default. One environment variable turns it on. The question is where you point it.
Why I route it through Bindplane
You could point OTEL_EXPORTER_OTLP_ENDPOINT straight at your observability backend. That works. But it means every developer manages their own export config, and it assumes your backend speaks raw OTLP.
Here's what I actually care about. 👇
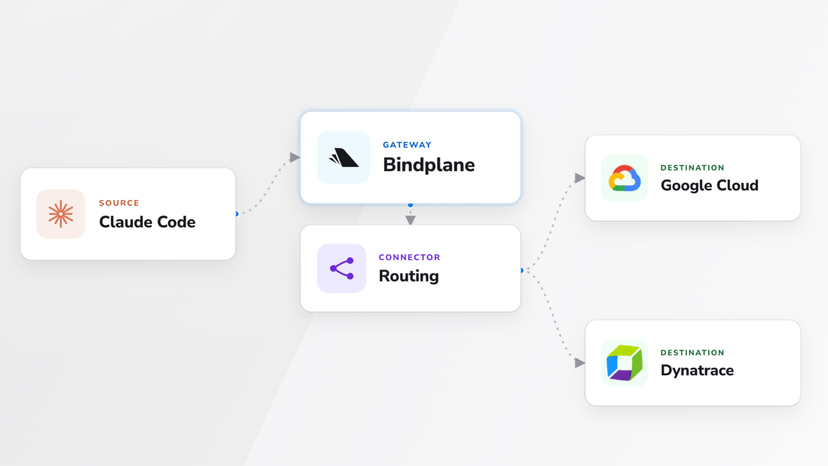
The telemetry lands in the same pipeline as everything else — infra metrics, application traces, whatever we already collect. It goes to the same place. No one on my team has to configure a separate export target.
Tool events (claude_code.tool_result) can include bash commands and file paths in tool_parameters. If any of those contain secrets, I want to redact them before the data leaves — not after it's already sitting in whatever observability backend you prefer using. A Bindplane processor handles that in the pipeline, invisible to the developer.
And, because Claude Code supports an administrator-managed settings file, I can deploy the environment variables org-wide without asking anyone to set anything manually.
Setting it up
Add the OTLP source
Open an existing Bindplane configuration or create a new one. Add the OpenTelemetry (OTLP) source. It listens on 4317 (gRPC) and 4318 (HTTP/protobuf) by default and needs no changes for a basic setup.

Add a destination. If you just want to confirm data is flowing, the Dev Null destination writes to /dev/null and gets you verified fast. Wire it up and roll the configuration out to a collector.

Note the collector's hostname or IP. You'll need it in the next step.
Set the environment variables
On any developer machine, add these to ~/.zshrc or ~/.bashrc:
1export CLAUDE_CODE_ENABLE_TELEMETRY=1
2export OTEL_METRICS_EXPORTER=otlp
3export OTEL_LOGS_EXPORTER=otlp
4export OTEL_EXPORTER_OTLP_PROTOCOL=grpc
5export OTEL_EXPORTER_OTLP_ENDPOINT=http://<collector-host>:4317Or drop them in the administrator-managed settings file and every developer on the team is covered without any per-developer action.

Verify in Live Preview
The first metric export happens after one minute (the default OTEL_METRIC_EXPORT_INTERVAL). Start a Claude Code session, run a couple of prompts, wait a minute, then open the Bindplane configuration and click any processor node. Look for records with service.name=claude-code.
If you see them, data is flowing.

One thing worth flagging
By default, user prompt content isn't included in telemetry — only prompt length. The signal that needs a closer look is claude_code.tool_result. Tool events can include bash commands and file paths in tool_parameters, and if those touch anything sensitive, you want a Bindplane processor redacting tool_parameters before the data reaches its destination.
Full prompt content is off by default. You can enable it with OTEL_LOG_USER_PROMPTS=1, but I'd think twice before doing that.
Know what you're exporting before you turn it on.
Start small
Try it on one developer machine first. Confirm the data looks right in your backend, set up whatever filtering you need, then push the config org-wide. It took me about five minutes. The data showed up exactly where I expected it. Zero custom code.
The full how-to guide below covers Kubernetes in-cluster DNS names, TLS, authentication headers, and a troubleshooting section for the common failure modes. 👇
Read the how-to guide: Send Claude Code telemetry to Bindplane
If you have more questions. Give us a shout in Slack!