Claude Code Observability at Scale: How We Did It With Bindplane
We build the industry's leading telemetry pipeline platform, so when we rolled Claude Code out to our entire team, there was only one way we were going to monitor it.

At Bindplane, we iterate fast. One of the most important tools we've adopted across our organization is Claude Code. It helps every team here build solutions to complex problems with both speed and precision.
But speed without visibility is a liability. We needed a reliable way to monitor and audit how Claude Code was being used across our team. Luckily, we build the best platform on the market for data in motion. This is how we use Bindplane to collect, pre-process, and route the OTLP telemetry Claude Code emits.
Why Bother Monitoring an AI Coding Agent?
Bindplane is built on OpenTelemetry, the second most active CNCF project, that just underwent CNCF graduation. As AI adoption is becoming the new normal, we recently shipped the Bindplane Skill for Claude Code to make our product as easy to adopt for agents as it is for humans. And like everything else we ship, we monitor it ourselves using the Bindplane Distro for OpenTelemetry (BDOT) Collector and Bindplane.
We had three reasons to instrument Claude Code:
- Security and incident management. Track and review prompts and responses for anything inappropriate, malicious, or injected into code we adopt. If something goes wrong, you need a durable record of what the AI agent actually did.
- Adoption. Understand how frequently our team uses Claude Code and whether it's improving developer experience. If it isn't, we need to know, and understand what's blocking it.
- Spend. Track token usage and tool calls so we understand the real cost/benefit of the tool. We don't cap access, but every organization should know what they're paying for and what they're getting in return.
What to Monitor in an AI Coding Agent?
Once we decided to instrument Claude Code, we identified four signal areas:
- Model usage and cost: Measure efficacy, adoption trends, and track spend to confirm the investment is paying off.
- Tool usage and rejection: Surface where the agent misreads intent or hits friction. Use those signals to tune system prompts, permissions, and team best practices.
- Data sent and received: Maintain a durable record of what the model received and transmitted, which is essential for auditing, compliance, and incident response.
- Tool approvals: Approved tool calls are where Claude Code actually acts on your environment. That's the highest-risk surface. Tracking them lets you detect anomalies, enforce least-privilege policies, and give your security team what they need to investigate.
How does Bindplane use Bindplane?
Our setup follows a standard OpenTelemetry workflow with four steps:
- Collection: Deploy a Bindplane Distro for OpenTelemetry (BDOT) Collector to collect the telemetry data Claude Code emits.
- Instrumentation: Configure Claude Code to emit OTLP telemetry data.
- Pipeline Configuration: Configure the BDOT Collector to route telemetry data to multiple destinations.
- Telemetry Data Storage and Dashboards: Store the telemetry data and make sense of it.
Let’s jump into it, step-by-step.
1. Deploying the Bindplane Collector
We use a Mobile Device Management platform to deploy a BDOT Collector instance to every developer's machine connected to a Bindplane project.

2. Enabling OpenTelemetry in Claude Code
Authentication is handled with SSO across the organization for both the Claude web console and Claude Code. We ship a managed settings.json file that layers organization-wide defaults on top of each developer's local config. The defaults turn telemetry on, point OTLP at the loopback collector, and enable enhanced tracing.
1{
2  "env": {
3    "CLAUDE_CODE_ENABLE_TELEMETRY": "1",
4    "OTEL_METRICS_EXPORTER": "otlp",
5    "OTEL_LOGS_EXPORTER": "otlp",
6    "OTEL_EXPORTER_OTLP_PROTOCOL": "grpc",
7    "OTEL_EXPORTER_OTLP_ENDPOINT": "http://your-collector:4317",
8    "OTEL_METRIC_EXPORT_INTERVAL": "10000",
9    "OTEL_LOGS_EXPORT_INTERVAL": "5000"
10  }
11}When a developer launches Claude Code, they're prompted to accept the new defaults or log out.
Routing data to a local BDOT Collector sidesteps the need for a publicly accessible OTel Collector endpoint with mTLS and all the security overhead that comes with it. The tradeoff is that this approach doesn't cover cloud-based agents or tools like Claude Cowork since they require a publicly accessible OTel Collector. We'll cover how to set that up in the next post in this series.
3. Configure the Pipeline
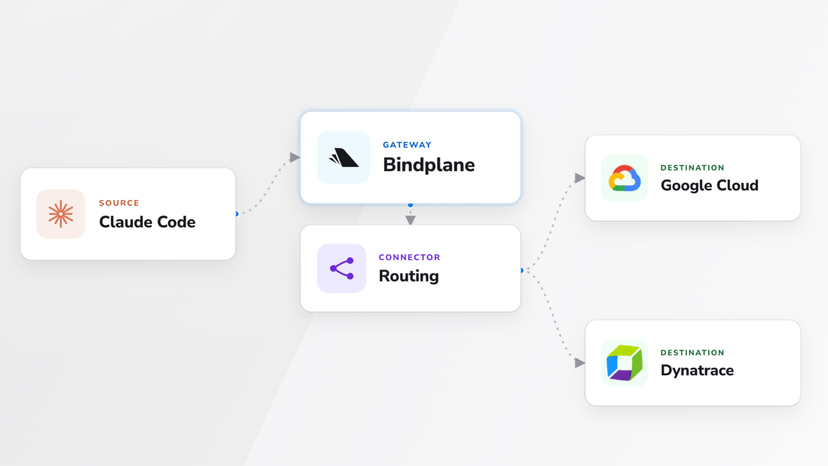
We fan the same telemetry out to three destinations, each serving a different purpose.
Let’s dive into what the configuration looks like, in particular, the source, destinations, and processors in Bindplane. This configuration is then deployed to all BDOT Collectors across all developer devices.
Configuring the Source
In our settings.json file above, Claude Code is configured to send data locally, to 127.0.0.1:4317, using gRPC. This is the same value you’ll set in the OpenTelemetry (OTLP) source in your Bindplane configuration, as shown below.

Configuring Processors and Destinations
For our use case, we configure three destinations with a bit of pre-processing for security and compliance purposes, as described below.
Google Cloud Monitoring (GCP) Destination, which receives logs, metrics, and traces, but with redaction applied prior to data ingestion. If sensitive fields such as email, phone number, SSN, etc. are found in any data that Claude Code attempts to send to GCP, it is immediately redacted as shown below, using our Redact Sensitive Data processor. Bindplane's filter-by-condition processor also lets us drop spans based on substring matches, so we don’t overload what we store and pay for in Google Traces.

A GCS bucket gets full-fidelity trace events with encryption at rest and a configurable retention period (we've been talking about 30 days as a starting point). This is the audit trail. If we ever need to go back and answer "what did the agent actually do during incident X," it's there. It's just not the dataset that drives day-to-day dashboards.

Swarmia gets a slice of the metrics for developer experience analysis such as throughput, PR turnaround time, and signals around AI adoption.
4. Data Storage and Dashboards
Below are the dashboards we built in Google Cloud Logging and Google Cloud Tracing. Model usage, tool calls, token spend, and trace detail, all flowing from the same pipeline.


No Lock-In by Design
Splitting egress with a config change, not a migration, is how you stay vendor-agnostic. If a destination gets too expensive or stops working for your team, you swap it out. We built Bindplane, and our developers, SRE team, and security team all depend on it to do their jobs. Trying new tools like Claude Code is only possible because our collectors and configurations make it easy.
What’s Next?
Monitoring an AI coding agent isn't fundamentally different from monitoring any other developer tool. The signals are the same:
- Who's using it and how?
- What’s it doing on your behalf?
- Does the telemetry answer your questions?
- Do the answers match what you expected?
Claude Code emits telemetry using OpenTelemetry's open standard. Bindplane gives you the control plane to decide what to keep, what to scrub, and where it lands.
If you're rolling Claude Code out to your team and you don't have an answer for "what is my team doing with Claude Code" start there.
Bindplane is a platform for building and deploying OpenTelemetry-based telemetry pipelines at scale. Learn more here.