Deduplicate logs at the edge: Same insights, a fraction of the volume
Repeated log lines are the most expensive noise in your pipeline. Here's how to collapse them in Bindplane before they ever reach your backend, keep an exact count of every occurrence, and prove in Dynatrace that you lost nothing that matters.


Ask a platform team why their observability bill keeps growing and you'll often get a one-sentence answer:
“The devs won't fix their logging.”
And that's usually where it ends. The application teams own the log output, the platform team owns the bill, and nobody has the leverage to change what gets emitted. A single retry loop can print the same error thousands of times a minute. Every one of those lines is ingested, indexed, and stored. You pay for all of them, and they tell you exactly one thing: this error happened, a lot.
This is the second of the two reasons log pipelines stall. The first is compliance, which we covered in Redact PII at the edge. This one is cost. The answer has the same shape: fix the data in the pipeline, not in the backend.
The requirement isn't "log less," it's "store each fact once"
You don't actually need ten thousand copies of connection to payment-gateway timed out. You need to know that it happened, when it started, when it stopped, and how many times it fired. That's one log record and a counter.
That's exactly what deduplication at the edge does. The Bindplane collector holds a short time window, collapses identical records inside it into a single record, and stamps that record with a count and the first and last time it was seen. If the same error fires 1,700 times in ten seconds, your backend receives one log with log_count: 1700. Same facts, a fraction of the volume, and it happens before signals hit the telemetry backend. You can shift this left without asking a single dev team to change a single log line.
What we're building
A pipeline that takes a noisy checkout service, deduplicates its error logs on a 10 second window, counts every raw occurrence as a metric, and lands both in Dynatrace.

Step 1: Start with a noisy log stream
We'll showcase a pipeline that's already sending logs to Dynatrace. The checkout service is having a bad day. The payment gateway is timing out, and the service logs the same error on every retry.

Note what varies between these records. The trace_id, the thread.name, and the time. The body is byte-identical. That distinction matters in Step 3.
Step 2: Add the Deduplicate Logs processor
In your configuration, add the Deduplicate Logs processor to the pipeline.

By default, two logs are considered duplicates when the severity, body, resource attributes, and log attributes all match. That default is stricter than we want here, and here's why.
Step 3: Exclude the fields that always vary
Our duplicates aren't perfectly identical. Every record carries a unique trace_id and a rotating thread.name. Left alone, those fields make every log unique, and nothing gets collapsed.
The processor gives you two mutually exclusive options. Included Fields restricts matching to only the fields you list, and Excluded Fields ignores the fields you list. We'll exclude the volatile ones:
1attributes["trace_id"]
2attributes["thread.name"]Set the Interval to 10 seconds. That's the collapse window. Everything identical within it becomes one record. Leave Count Attribute Name at its default, log_count. That's where the number of merged records lands.

Exclude narrowly. Every field you exclude is a distinction you can no longer see. Trace IDs and thread names are safe because they don't change what the error means. Something like http.status_code is not. Excluding it would merge a 502 and a 504 into one record, and that's a real signal destroyed.
Step 4: Count every occurrence before you collapse anything
Deduplication keeps the count in an attribute, which is fine for reading a single record. For dashboards and alerting you want a proper metric, and you want it computed from the raw stream, before the dedupe window touches anything.
That's a job for a Count connector. Processors work inside a pipeline; connectors sit between pipelines and can change signal types. Count consumes logs and emits metrics.
Click the edge between your source and the processor chain and add the Count connector. Set the telemetry type to Logs, then define a custom count:
- Metric name:
checkout.payment_errors.count - Condition:
severity_number >= SEVERITY_NUMBER_ERROR - Attributes:
service.name,deployment.environment

Defining a custom count suppresses the default log.record.count metric. If you want total log volume as a metric from the same connector, re-declare it alongside your custom count. Do that here, because the pair is the whole story. Total volume drops, error count doesn't.
The connector's output is a new metrics pipeline. Attach your Dynatrace destination to it.

Step 5: Save, roll out, and watch the volume fall
Save the configuration and roll it out to your collectors.

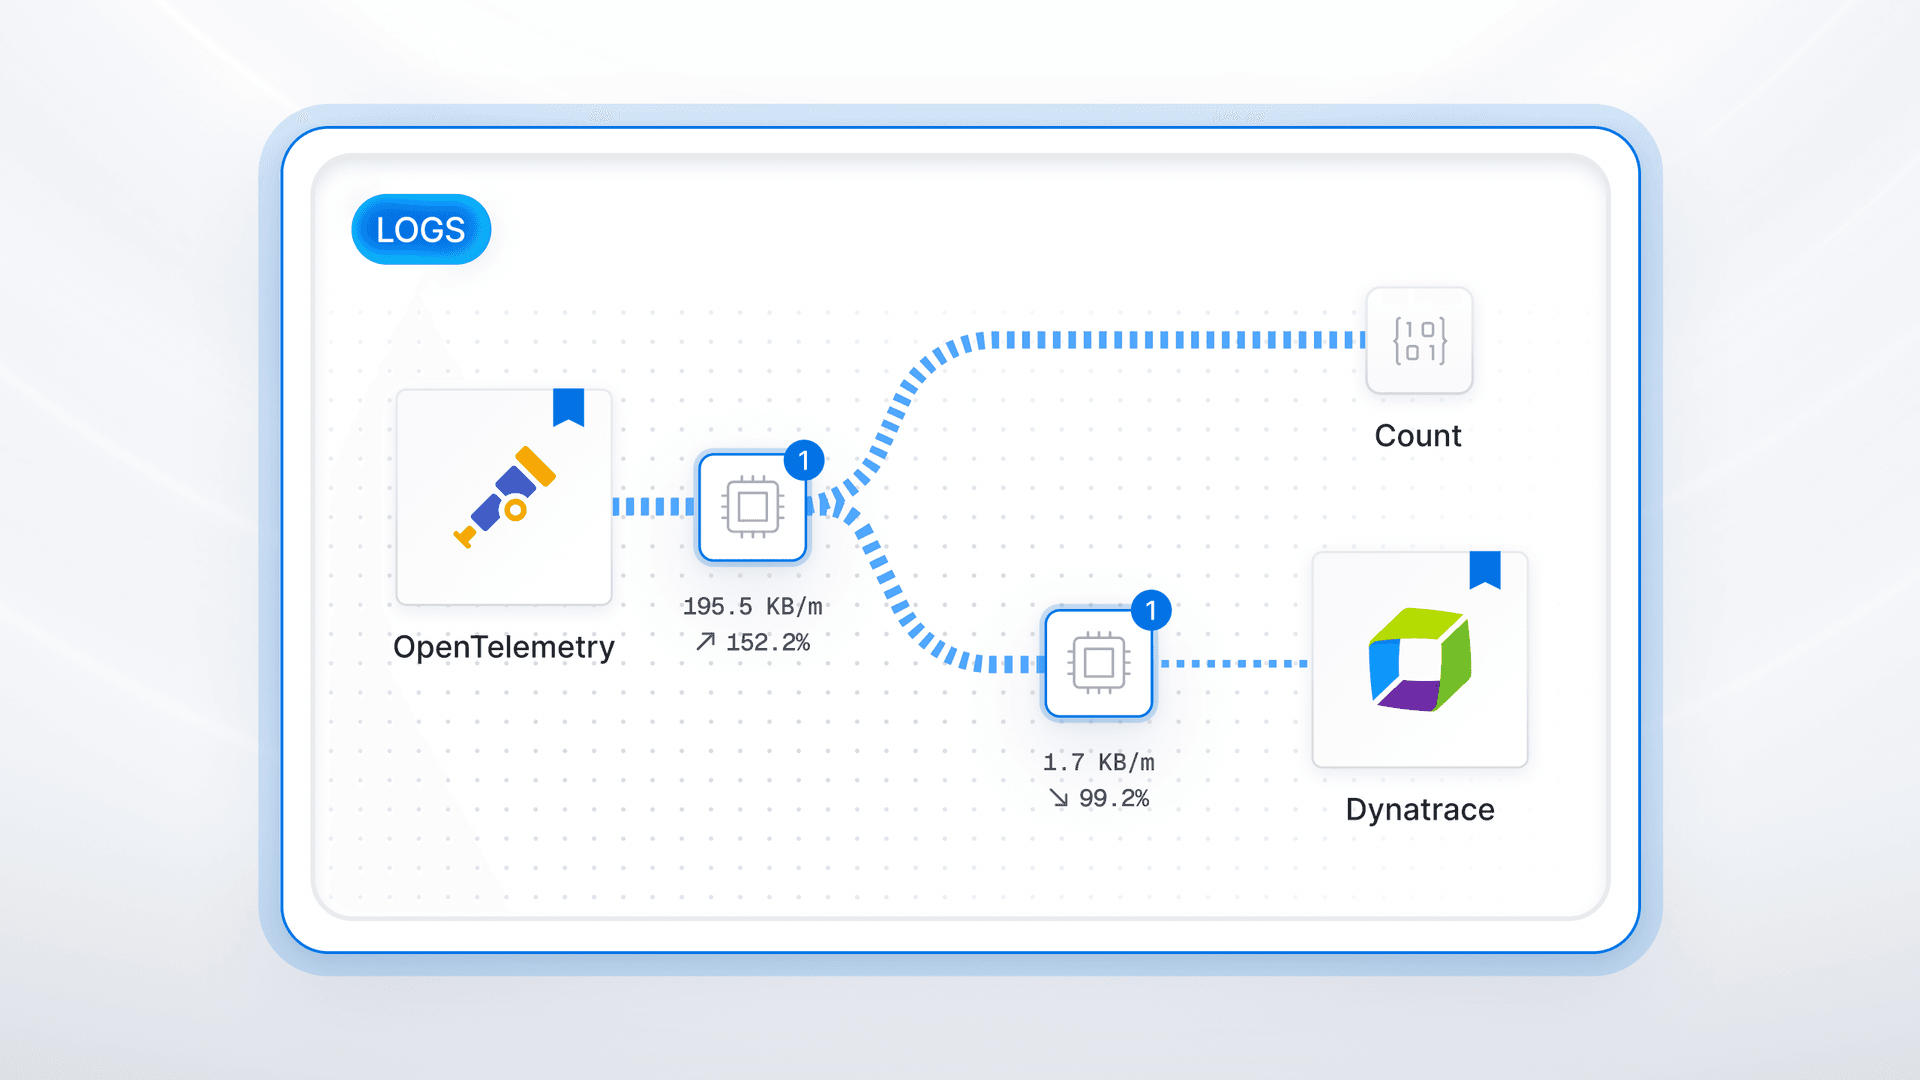
Bindplane shows the effect immediately in the pipeline throughput view. In our run, roughly 1,000 log records per minute entering the processor became about 6 leaving it. Down from 195KB/m to 1.7KB/m.

Open the destination processor node. You can see the error with log_count: 163. You see all errors in a 10 second interval in a single record. The Dedupe processor also adds a first_observed_timestamp and a last_observed_timestamp ten seconds apart, bounding the burst it stands for.

Query the logs in Dynatrace and open one of the surviving records. You’ll see the exact same outcome. An error with log_count telling you how many records it stands for, plus the first and last observed timestamps.

Step 6: Prove the fidelity holds
The objection to deduplication is always the same:
"We lose data."
Let's check. Build a Dynatrace dashboard with three tiles.
The first tile charts what your backend actually stores. This is the line that falls off a cliff at rollout.
1fetch logs
2| filter matchesValue(service.name, "checkout")
3| makeTimeseries records_stored = count(), interval: 1mThe second tile recomputes the true occurrence count from the surviving records. Deduplicated records carry the merge count in log_count, and untouched records count as one.
1fetch logs
2| filter matchesValue(service.name, "checkout")
3| fieldsAdd occurrences = coalesce(toLong(log_count), 1)
4| makeTimeseries actual_occurrences = sum(occurrences), interval: 1mThe third tile charts checkout.payment_errors.count, the metric the Count connector computed from the raw stream in Step 4.
1timeseries errors = sum(checkout.payment_errors.count), interval: 1m, by: { service.name }Records stored drop roughly 170x. The other two lines sit on top of each other, unchanged, through the rollout. Two independent proofs of the same claim, one derived from the surviving logs and one measured before dedupe ever ran.
For troubleshooting, add a table tile that lists the deduplicated records themselves, with the count and the window each one stands for.
1fetch logs
2| filter matchesValue(service.name, "checkout") and isNotNull(log_count)
3| sort timestamp desc
4| fields timestamp, content, log_count, first_observed_timestamp, last_observed_timestamp
5| limit 50
The ingest line falls off a cliff at the moment of rollout. The error count line doesn't move. Every occurrence is still counted, every alert built on the error rate still fires, and the log record itself is still there for troubleshooting. This is the same pattern as the searchable-hash dashboard in the redaction post. The pipeline does the destructive work at the edge, and Dynatrace proves nothing you needed was deleted.
Two caveats before production
Cardinality costs memory. The collector buffers one record per unique combination until the window closes. A short interval with repetitive logs is cheap. A long interval over high-cardinality logs is not. Start at 10 seconds and measure before going longer.
Output arrives in bursts. Records emit when the window closes, so anything downstream sees logs up to one interval late. For a 10 second window that's rarely a problem; just don't set a 5 minute window on logs that feed a latency-sensitive alert.
Where this applies
The teams that get the most out of this are the ones drowning in logs they don't control: high-volume transactional businesses in retail, airlines, insurance, and finance, and anyone running chatty infrastructure where retry storms and health checks dominate the stream.
Deduplication is one lever. It pairs with redaction at the edge for compliance, and with sampling and filtering for volume you'd rather not keep at all. If your team has been saying "we can't afford to keep these logs," the constraint is narrower than it looks. You don't need every copy of the line. You need the fact, the count, and the window. That's a different, much smaller bill.




 Slack
Slack GitHub
 x.com
x.com LinkedIn