Bindplane’s AI Agent is now generally available, plus what else we're bringing to KubeCon NA 2026
Plain-language pipeline building, a new Overview page, Gateways and Edge Fleets, Blueprints in the wizard, and where to find us in Salt Lake City.

KubeCon + CloudNativeCon North America is in Salt Lake City this week, and Bindplane will be at booth 253. Come say hi!
We have four talks and we're bringing a ton of cool updates with us. So many of you were eager to try Bindplane Agent while it was in early access. That changes today.
Bindplane Agent is generally available.
If you've built pipelines in Bindplane before, you know the drill. Pick a source, pick a destination, add processors in the right order, fill in the settings, roll it out. That's already faster than writing OTel Collector YAML by hand, but it still requires you to know what goes where. Bindplane Agent removes that step. You describe the outcome. It builds the pipeline. Here's the rundown.
The OTel pipeline that builds itself
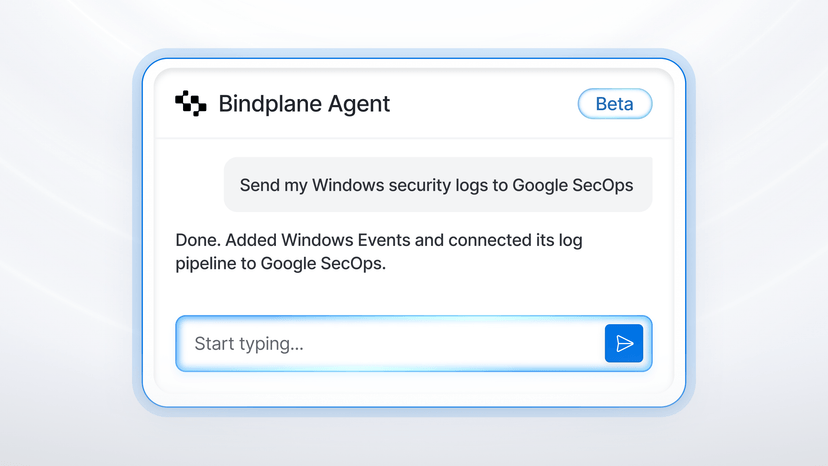
Bindplane Agent is an AI assistant built into Bindplane. It lives in the bottom-right corner of the UI. You tell it what you want in plain language and it edits the graph in front of you.
- "Collect my Windows security logs and send them to Google SecOps."
- "Send my Kubernetes logs to Dynatrace."
- "Set the batch size on my batch processor to 200."
It adds sources, destinations, and processors, and you watch each node appear as it works. Nothing deploys until you roll it out. You stay in control.

It also works in reverse. Ask "Which sources send logs, and where do they go?" and it walks the graph for you. Ask it to explain a processor bundle somebody built two years ago and it will. Inherited pipelines are the quiet tax on every platform team. Someone built it, someone left, nobody wants to touch it. Bindplane Agent reads it so you don't have to.

It's available today to every organization with Pipeline Intelligence enabled. Your org admin flips it on. That's the whole rollout.
Read the docs, here.
See the whole deployment on one page
Bindplane now gives you a new Overview page. It has three tabs, and together they answer the three questions every user wants to know. How much data is flowing through the pipelines, how much am I saving, and is everything healthy?
Data Flow answers where all your data is actually going. Like a sanity check of your whole deployment. Configurations on the left, gateways in the middle, and destinations to the right. Every line sized by throughput. Below you see one configuration carries 94% of ingest and one destination takes 88% of egress. One glance, not multiple configuration pages.

Topology answers what connects to what. The same deployment as a graph, throughput on every edge. A destination that stopped receiving data shows up greyed out. On a Monday morning that's the first thing you want to know.

Summary answers if the fleet is healthy. Collector health, rollouts, version spread, and a throughput chart over 24 hours, 30 days, or 90 days with data in against data out. If someone has asked you "what are we actually saving with this thing," the answer is now a screenshot.

Gateways and Edge Fleets are first-class now
Every large Bindplane deployment uses the same architecture. Agent-mode collectors on the edge collect telemetry from apps and devices. Gateway-mode collectors transform and route telemetry to storage. Two collector roles, two responsibilities. And the two are not equal.
Lose one edge collector and you lose one host's logs for a while. Annoying. Lose a gateway and every collector behind it stops delivering. Catastrophic.
Until now Bindplane treated both the same. Same binary, same table, same row. The gateway binary and a gateway label got you most of the way, which is what we do in production, but when 5 gateways sit in a table of 3,000 collectors, finding the one that matters means knowing your own naming scheme by heart. That's fine for the person who built it. It's a bad day for the person who inherited it.
That changes now. A collector has a role, Agent or Gateway, and the whole product knows which is which.
Gateways are a first-class resource. Own nav entry, own table, own install flow. Choose Gateway in the install wizard and Bindplane recommends Kubernetes, because that's where most gateways actually run. Install it by hand or let the OpenTelemetry Operator deploy it. A gateway configuration can only be assigned to a gateway, so an edge config never lands on the aggregation tier by mistake. Every gateway reports its own throughput.

Edge Fleets are Fleets with a narrower job. They group the collectors on VMs, workstations, and Kubernetes nodes. Edge only. Gateways don't join fleets. The Collectors table gets filter tabs for Gateway Instances and Edge Fleet Collectors, so the 5 that can take the whole pipeline down are one click away from the 3,000 that can't.

Assignment follows one ladder. Gateway configuration first, then fleet, then label.
Read the docs on Agents vs Gateways.
Full-Pipeline Blueprints, right where you build configurations
Full-Pipeline Blueprints now live where you actually need them. Click "Create Configuration", give it a name, and "Build from Blueprint" is the first option you see.
A Full-Pipeline Blueprint is a full set of resources that include: a source, a set of processors, routing, batching, and a destination; assembled and tuned for that source. Parsing, filtering, masking, and sampling are already in place. You still decide whether each one belongs in your pipeline. You just don't build them by hand. The largest includes 32 processors! That's 32 processors you review and add with a single click of a button instead of manually creating them all by hand.

See the Blueprints docs.
Where the Bindplane team is speaking
We have four talks in Salt Lake City this year. Two on Monday at the co-located events and one on Thursday at the main conference.
Ekansh Gupta speaks twice on Monday, November 9.
Treating Backstage Like a Product: Observability with OpenTelemetry, BackstageCon at 12:55 PM
Plenty of teams run their internal developer platform on Backstage. Few measure it. Ekansh instruments the Backstage backend with OpenTelemetry so you can see plugin health, which capabilities get adopted, and where developers actually hit friction, then feeds it through an OpenTelemetry Collector into live dashboards. All open source.
Cost-Aware GitOps: Automating FinOps with Argo Workflows, ArgoCon at 2:05 PM
Most teams manage cloud cost through dashboards and periodic reviews while the systems generating the cost run around the clock. Ekansh shows how to use Argo Workflows and Argo Events to build event-driven workflows that react to utilization signals, find idle resources, and run cleanup and rightsizing on their own, with GitOps keeping the whole thing auditable and repeatable.
Auto Deriving Threat Signals from OTel CPU Profiles & OBI Network Flows, Observability Day at 3:55 PM, with Shivanshu Raj Shrivastava
Two signals you probably already collect, continuous CPU profiles and network flows, carry a security story on their own. A crypto-mining hot path or a workload talking to an IP it has never contacted before is a threat indicator in plain sight. Ekansh and Shivanshu fuse OTel eBPF profiles with OBI network flows to baseline each workload and surface lateral movement, unexpected egress, and suspicious execution without writing a single detection rule.
Laura Luttmer closes out the week on Thursday, November 12.
Fast and Furious: OTel Drift — Salt Lake Ballroom C at 3:30 PM
Laura put an OpenTelemetry Collector in a toy RC car. She'll drive it around the stage to show what a trace looks like with no HTTP request to start it, and what the Collector does when the network disappears for ten minutes. A large automotive manufacturer is asking the same questions about every car leaving their production line.
Monday is also Observability Day. We'll be there as community contributors. Our own Andy Keller maintains OpAMP upstream, and a good part of our day is set aside to work on where OpAMP will go next. If you have opinions about how collectors should be managed at fleet scale, Monday is the day to find us.
Find us in Salt Lake City
OpenTelemetry is the standard. OpAMP is how you run it at fleet scale. Bindplane is the control plane that makes both operable without a team dedicated to YAML. That's what we're showing all week.
Stop by booth 253 in Hall 3 of the Solutions Showcase, Tuesday through Thursday. Watch Bindplane Agent build a pipeline from a sentence, see the Overview page light up with a live fleet, and catch the full lineup of talks, demos, and office hours. Bring the pipeline that has been bugging you. We'll fix it at the booth. Here's to the future of OpenTelemetry.

Want to try Bindplane Agent before you get to the booth? Sign up for Bindplane Cloud and ask it to build something. Questions go to the Bindplane Community Slack.
See you in Salt Lake City.


 Slack
 GitHub
 x.com
 LinkedIn