OpenTelemetry in Production: A Primer
OpenTelemetry has emerged as the gold standard fueling o11y and SIEM platforms, but transitioning an existing telemetry stack requires careful planning and execution. This guide outlines a practical approach to evaluating, implementing, and scaling OpenTelemetry in production environments.
Taking an Inventory
Before making the switch, thoroughly assessing your current environment is crucial. This inventory phase helps identify potential challenges and determines the scope of your implementation.
- What business-critical applications need to be observed in your environment?
- What programming languages are being used in your stack?
- What observability tools are you currently using in your stack?
- What signals are being collected, and how are they being collected?
- Where do you intend to send and analyze your telemetry data?
A high-level understanding of the answers to these questions will allow you to take the next step - mapping your organization's needs to specific OpenTelemetry components that facilitate telemetry collection, transformation, and delivery.
Familiarizing Yourself with OpenTelemetry
To map the necessary OTel components to your use case, taking the time to familiarize yourself with the project better is a worthy exercise, as there’s a fair amount to digest. To do so, I’d recommend taking a look at a few essential resources:
- OpenTelemetry 101, our CEO, Mike Kelly, does an excellent job walking users through an OpenTelemtry 101 crash course.
- The Official OpenTelemetry Demo provides an expansive environment demonstrating instrumentation and usage in a typical Kubernetes-backed microservices environment.
- OpenTelemetry Registry provides a searchable list of OpenTelemetry components, simplifying the OTel mapping process.
- Awesome OpenTelemetry is an excellent compendium of OpenTelemetry guides and resources.
- Lastly, if you want to kick the tires and get an OTel collector up and running, doing so will provide you with a guide and some context for what it’s like to configure a collector and start shipping telemetry data in about 10 minutes.
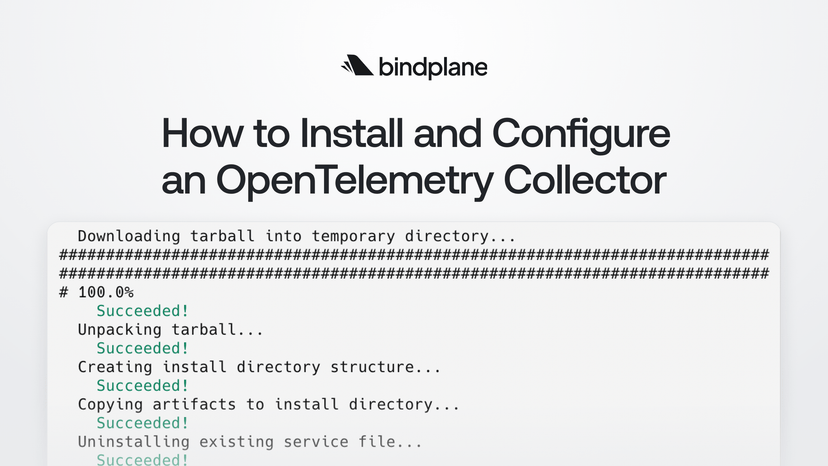
Related Content: How to Install and Configure an OpenTelemetry Collector
Selecting a Collector Distribution
Next, it’s essential to know that several distributions of the OpenTelemetry Collector are available. Choosing one that aligns with your requirements is critical - but take comfort in knowing that the available configuration and components largely remain the same across distributions.
Here’s a quick breakdown of what’s available:
OpenTelemetry Collector Contrib
This distribution includes the most components (receivers, processors, exporters) and is where you find the newest components that have not yet made it into the OpenTelemetry Collector Core repository. Generally, this is the right place to start if you want to test the waters with a sandbox collector, but it may include more stuff than you need when you’re ready to deploy to production.
OpenTelemetry Collector Core
This distribution includes a minimal, hardened set of components. We typically don’t recommend it for production environments, as the core distro is not expansive enough (yet) to address some of the most common use cases requested by customers we see daily.
Vendor Distributions
As the name implies, vendor distributions are built and managed by a specific vendor. It’s important to know that these distributions can include components specific to the vendor’s platform, resulting in unnecessary vendor lock-in. If you’re considering a vendor distribution, inquire about functionality specific to the distribution to understand the impact of moving away from the distribution in the future.
One advantage of vendor distribution is that they often include support as a primary benefit, providing an SLA frequently required for larger organizations.
Bindplane's Distribution
It’s also helpful to know that Bindplane offers a supported distribution. It supports OpAMP and enables remote agent and OTel configuration management with Bindplane.
Building your own OTel Collector
Lastly, building your collector distro is an option as well. With the OpenTelemetry Collector Builder, you can create a distro that only includes the necessary components - minimizing unnecessary bloat and simplifying configuration.
Deployment Patterns
Next, let’s take a look at some common deployment patterns. These are typical patterns we’ve seen in the field - but are flexible enough to scale with any environment.
Instrument app ⇒ gather with an OTel collector (separate host)
In this pattern, a custom application has been instrumented to expose OTLP metrics and traces gathered by a collector running on a separate host.

This pattern has a few pros and cons:
- Pros
- It’s a simple pattern, providing a 1:1 mapping between an application and a collector
- Mitigates risk by deploying the collector to a host separate from your application
- Putting a collector in between your instrumentation and backend allows you to easily filter and reroute your data without modifying your app infrastructure
- Cons
- 1:1 application-to-collector ratio doesn’t scale for larger workloads
- If the collector is deployed on a separate host from the application, it’s unable to gather host metrics and log data, missing out on some telemetry that could be used for root cause analysis
Instrument app ⇒ OTel collector (same host)
In this pattern, a custom application has been instrumented to expose OTLP-compatible metric, log, and trace data gathered by a collector running on the same host.

- Pros
- Deploying a collector locally for log and metric collection from the node/host, in addition to gathering the application-specific telemetry, providing a complete picture of your application and host it’s running on for root cause analysis.
- Cons
- It may require an infrastructure change if there are not any agents or collectors deployed in your environment
Instrument app ⇒ OTel collector (same host) ⇒ load balancer ⇒ collector group
In this pattern, a collector has been deployed to the same host as the application. The collector is forwarding its data to a group of collectors behind a load balancer.

- Pros
- Scaling and redundancy when dealing with large amounts of telemetry data or high processing needs
- Cons
- More complexity when the data volume is low
Requires separate tooling/hardware to yield desired scalability redundancy
- More complexity when the data volume is low
Instrument app ⇒ OTel collector (same host) ⇒ Gateway
Lastly, in this pattern, collectors have been deployed in this environment to act as gateways, which allow telemetry to be aggregated before reaching an observability backend.

- Pros
- Highly scalable data plane standardized on OpenTelemetry.
- It is easy to add new destinations with access to any/all of your telemetry data. No need to re-instrument with vendor agents/SDKs
- By aggregating telemetry with a gateway, a user can refine the data at a central point in the pipeline.
The observability pipeline is shifted further away from a specific vendor.
Migrating to OpenTelemtry
Next, let’s talk about migration. Most organizations have large, already-existing deployments with proprietary instrumentation and agents. Thus, we typically recommend migrating to OpenTelemetry in a phased process. High-level breakdown below:
Phase 1: Greenfield OTel deployment

We recommend using OpenTelemetry in greenfield deployments -- working with a clean slate in a PoC environment to minimize noise and risk. It enables customers to see the value of OpenTelemetry quickly.
Phase 2: Redirect existing agents using OTel

Once you’ve successfully tested OTel in your greenfield environment, you can repoint your existing agents to OTel collectors. Knowing that FluentD, Fluent Bit, Splunk agents, and more can have their output redirected (or duplicated) to OpenTelemetry collectors is critical.
Phase 3: Replace existing agents with OTel Collectors

The last phase is replacing your existing instrumentation with OTel instrumentation. Replacing your observability stack with pure OTel is not required but is recommended when it is available.
If you’re considering, have questions, or want to chat about OTel in production, contact us at info@bindplane.com. Thanks for reading!