KubeCon North America 2025: OpenTelemetry Recap from Atlanta
Here’s my full recap of the announcements, roadmap updates, and community moments that stood out.
KubeCon + CloudNativeCon North America 2025 wrapped up in Atlanta last week, and it sure did feel like a big one for OpenTelemetry. Between Observability Day, the project updates, and the activity around the OpenTelemetry Observatory booth, you could feel how quickly the ecosystem is maturing.
OpenTelemetry: What’s New and Where Things Are Going
OpenTelemetry reached several milestones this year, and a lot of them point toward a much smoother developer experience in 2026.
A few highlights from the governance and maintainer updates:
- Declarative Configuration (Experimental) — A unified way to configure SDKs and instrumentation across languages. This is huge. Less fragmentation and far easier onboarding.
- OBI (Alpha) — Progress on the OpenTelemetry eBPF Instrumentation
- Structured Logging & Complex Types (Stabilized) — Events and logs now support nested structures and rich attribute types. No more flattening everything into strings.
- More Semantic Conventions Finalized — Database conventions are done. RPC and system-level conventions are on the way.
- Stability + Release Process Work — The project is aligning on better definitions of stability across such a massive set of components.
- Upcoming Events

2026 Roadmap: A More Usable OpenTelemetry
What’s coming:
- A universal declarative config model across SDKs
- More built-in eBPF instrumentation paths
- Richer semantic conventions for profiling, messaging, RPC, Kubernetes
- Structured logging APIs for client-side telemetry
If you’re standardizing on OTel, now is the time to get ahead of declarative config and watch the eBPF work closely.
Observability Day Vibes
The Observability Day co-located event at this year’s KubeCon North America had incredible energy. Packed rooms, awesome hallway conversations, and maintainers interacting with end users. I could see the community bonding in real time.
Here are the talks that stood out for me.
Austin Parker — Seeing Isn’t Believing - A Practical Guide To AI Trace Analysis
Austin kicked off the day with an engaging walkthrough of how LLMs actually work and what that means for observability.
He showed how transformer models form stable internal concepts, like reliably identifying a “bear” across SVG and ASCII, but warned that this doesn’t magically make them safe autonomous agents. LLMs love taking confident, destructive actions if you let them.
Then he brought it back to telemetry. Real-world traces are massive:
- ~200 attributes on median spans
- 40k+ on p99 spans
- Typical traces 50–500KB
- Some outliers hitting 20MB+
That’s not something you want to push straight into a model.
Austin showcased a solution of converting time series into tiny ASCII line charts. This dropped token count by ~95% (122k → 372) while keeping enough shape for a model to reason with.
I learned that AI will definitely help with observability, once the data is compressed, structured, and we stop pretending everything should be an agent.

Henrik Rexed — 🧙♂️ Abracadabra! OTTL Turns Profiling Into Metrics
Henrik gave a fantastic deep dive into how profiling fits into OpenTelemetry.
His Kubernetes setup:
- An eBPF profiler DaemonSet on every node
- Dedicated collectors for metrics, traces, and logs
- A gateway tier aggregating profiling data
Then he explained the OTLP profiling data model. From location tables, function tables, mappings, and string tables. They're all index-based to keep payloads tiny.
The cool part was showing how to turn continuous profiling into metrics with OTTL.
Profiling stops being a “look at the flame graph once a quarter” exercise and becomes a real, production-safe signal you can alert on.
Henrik tied it all back to efficiency and sustainability where better profiling leads to fewer wasted cycles, a lower cloud bill, and ultimately a lower energy bill.

Juraci Paixão Kröhling & Dan Gomez Blanco — There's a Lot of Bad Telemetry Out There
This talk hit home for anyone who has ever looked at a trace and thought: “Why is this even here?”
Juraci and Dan broke “bad telemetry” into:
- Useless data
- Noisy data
- Expensive or risky data (PII, over-collection)
Their showcased a Java example of auto-propagated async context that was perfect in explaining their point. Well-intentioned instrumentation can create huge spans, duplicate attributes, and break trace boundaries.

Their solution is to use OpenTelemetry’s rule-based sampling and attribute filtering to stop noise before it ever gets exported.
Good observability isn’t about collecting everything, it’s about collecting what matters.

Cijo Thomas — High-Volume Logging Without High Cost: Flight Recorder for OpenTelemetry Logs
Cijo did my favorite talk of the day with an old idea but brand new implementation of the Flight Recorder pattern:
- Write logs to a local ring buffer
- Wait for a trigger (error, anomaly)
- Snapshot and export only that window

It works:
- in apps (like .NET’s
ILogger), - in OpenTelemetry Collectors,
- and even at the OS level (ETW, Linux
user_events).
The OS-native angle was especially cool. The kernel already behaves like a flight recorder, we just haven’t been using it that way. A super smart approach to keeping access to debug logs without ingesting everything 24/7.

Community Momentum
One thing that always stands out at KubeCon is the community. This year in Atlanta was no exception. The OpenTelemetry Observatory, sponsored by Splunk, was packed the entire conference. I just hung around, you got pulled into conversations about pipelines, semantics, the collector, and much more.
Spending time here was honestly my favorite part of the conference. I used the opportunity to ask OTel contributors and maintainers the question:
“What’s your favorite new OpenTelemetry update?”
I turned the responses into a short community video.
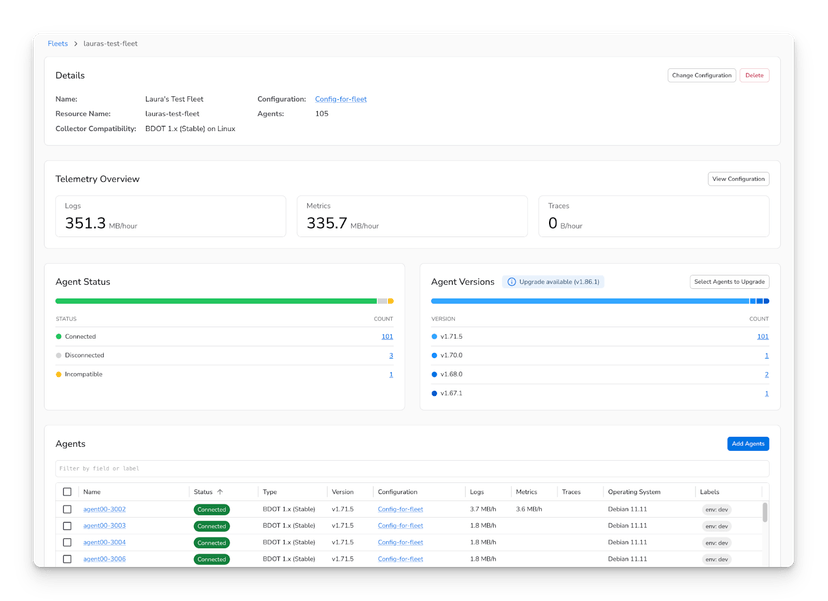
We also hosted a live Community Call directly from the KubeCon floor, walking through the new Fleets and Blueprints features in Bindplane (powered by OpAMP) and showing how they simplify managing large collector fleets.
You can watch the full session below.
Final Thoughts
OpenTelemetry continues to prove why it’s become the industry standard for vendor-neutral observability. With the new experimental declarative config, eBPF instrumentation, structured logging maturing, profiling becoming actionable, and a community that keeps growing stronger, 2026 is shaping up to be a huge year.
Now’s the time to lean into OpenTelemetry, and help shape the community.
See you at KubeCon + CloudNativeCon Europe 2026 in Amsterdam.


